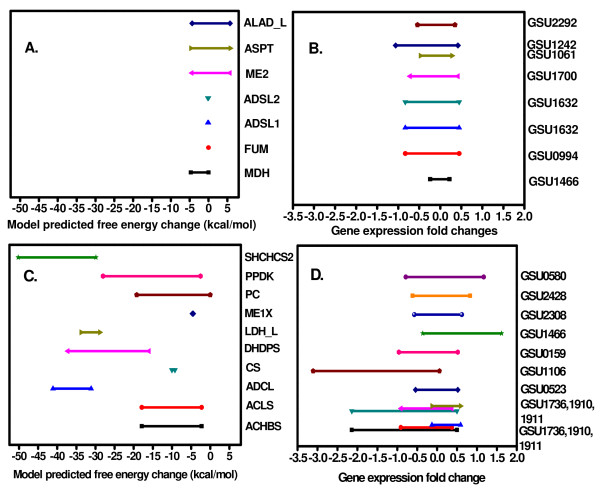
Figure 2.
Comparison of filtered gene expression fold changes across different conditions (environmental and genetic perturbations) and the corresponding ranges of the free energy changes for model predicted reactions subject to regulation (C and D) and thermodynamic bottlenecks (A and B) in G. sulfurreducens.

