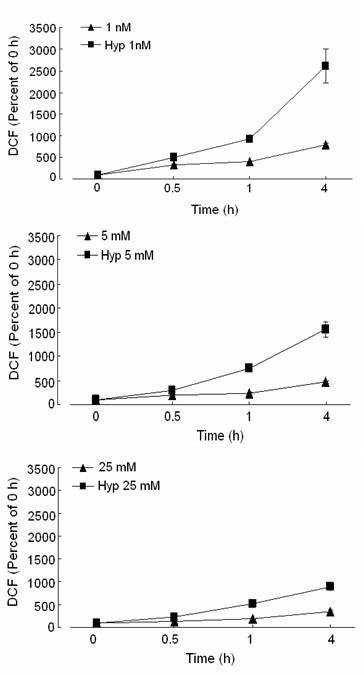
Figure 8.

Effect of hypoxia on ROS production in response to 1 nM, 5 mM, or 25 mM glucose. ROS production was measured in media and in cells after 0.5, 1, or 4 h of hypoxia (square) or normoxia (triangle) by the conversion of 2',7'-dichlorofluorescin diacetate (DCFH-DA) to 2',7'-dichlorofluorescein (DCF) and expressed as a percent of the 0 h. Note increased ROS production with hypoxia compared to normoxia, which was greatest at 4 h with 1 nM glucose.
