Figure 3.

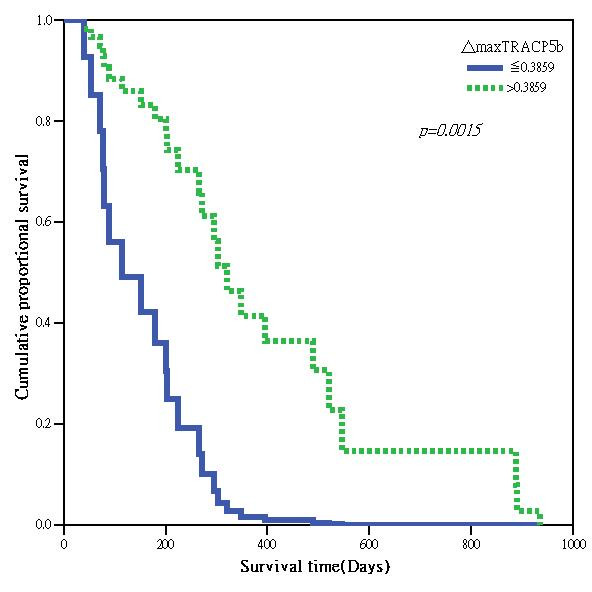
Survival curve comparing patients with baseline TRACP 5b activity ≥ 5.736 U/L grouped by ΔmaxTRACP 5b > 38.59% and ΔmaxTRACP 5b ≤ 38.59% in a Cox-regression model.

Survival curve comparing patients with baseline TRACP 5b activity ≥ 5.736 U/L grouped by ΔmaxTRACP 5b > 38.59% and ΔmaxTRACP 5b ≤ 38.59% in a Cox-regression model.