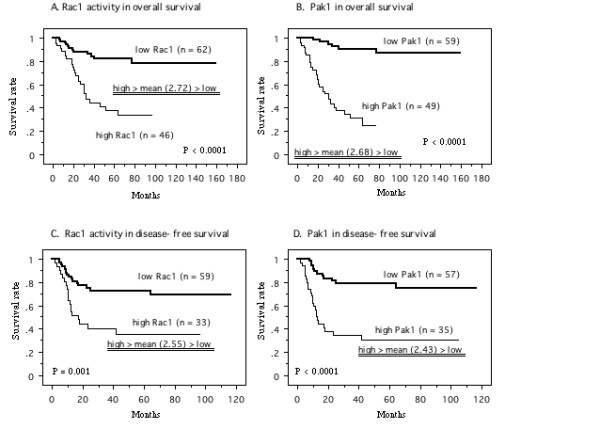
Figure 6.

Survival curve in the patients based on the mean values of Rac1 activity and Pak1 in primary tumor tissues, the cases were divided into two groups at this levels - high and low expression. A; Overall survival curve based on Rac1 activity in all patients. B; Overall survival curve based on Pak1 in all patients. C; Disease-free survival curve based on Rac1 activity in N0 M0 patients at nephroureterectomy. D; Disease-free survival curve based on Pak1 in N0 M0 patients at nephroureterectomy. P value was analyzed by log-rank test.
