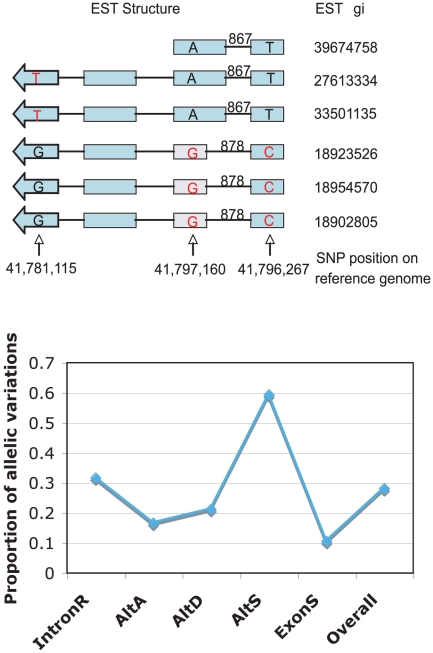
Figure 4. Distinguishing allelic gene structure variations from alternative splicing.
Upper panel shows a diagram using SNP on EST as tags to distinguish allelic variations from alternative splicing with one AltA case. The light boxes are exons, the lines linking these boxes represent introns, and the numbers above the lines are intron length. The letters within boxes indicate the SNPs at a specific position labeled in different ESTs (gi numbers are shown on the right). In the example here, the SNP pattern T-A-T is associated with one transcript isoform, while SNP pattern G-G-C is associated with another transcript isoform. SNPs existing in multiple ESTs were used to distinguish the allelic variations from alternative splicing (see methods), and ESTs that didn't have mSNP were removed from the estimations. Lower panel shows the frequency distribution of allelic gene structure variations in TSVs based on this method.

