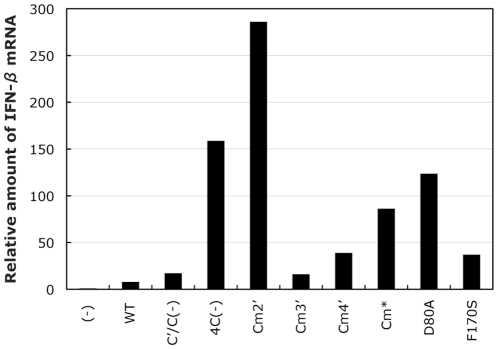
Figure 6. IFN-β production in the HeLa cells mock-infected and infected with the indicated viruses.
The relative amounts of IFN-β mRNA detected in the cells infected with the indicated viruses at 48 h p.i. revealed by one-step qRT-PCR are shown as a bar graph. The amount of the mRNA detected in the mock-infected sample was set to 1.

