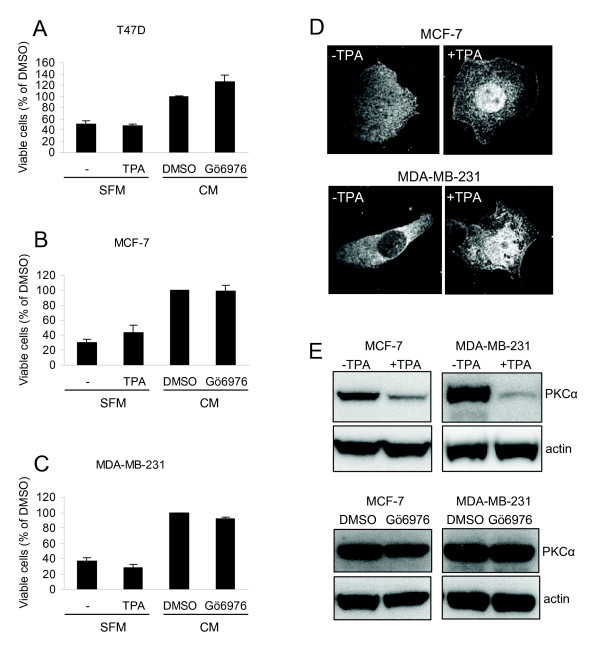
Figure 4.
Cell growth analysis after activation or inhibition of PKC. T47D (A), MCF-7 (B), and MDA-MB-231 (C) breast cancer cells were incubated in the absence or presence of 16 nM TPA in serum free medium (SFM) or 2 μM Gö6976, GF109203X, or equal volume of DMSO in complete growth medium (CM) for 72 hours prior to WST-1 assay. Data (mean ± SEM, n = 3) represent the amount of viable cells expressed as percent of viable cells obtained under control conditions. The localization of PKCα in control or TPA-treated MCF-7 and MDA-MB-231 cells was examined with immunofluorescence followed by confocal microscopy (D). The levels of PKCα following treatment with TPA or Gö6976 were analyzed by Western blot (E).

