Figure 5.
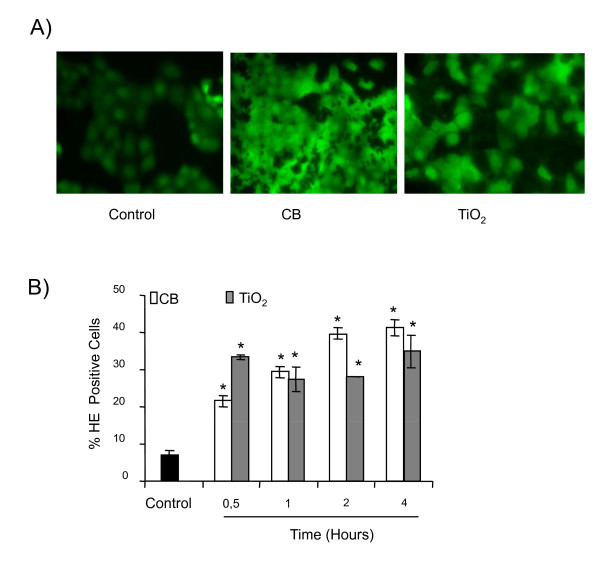
Induction of oxidative stress in 16HBE14o- cells by CB and TiO2 NPs. A) Cells were exposed to NPs (20 μg.cm-2) for 4 hours. At the end of exposure cells were loaded with DCFH-DA (40 μM) for 30 minutes and visualized under fluorescent microscopy (× 200). B) A time course study of HE staining (0.5 -- 4 hours) after exposure to CB and TiO2 NPs (20 μg.cm-2). At the end of incubation cells were labeled with HE fluorochrome (1 μM) for 20 minutes and analyzed by flow cytometry to determine the % of cells stained with HE. Data are represented as mean ± SD (n = 3). Representative result of three independent experiments. * statistically different from control p < 0.05 (two tailed).

