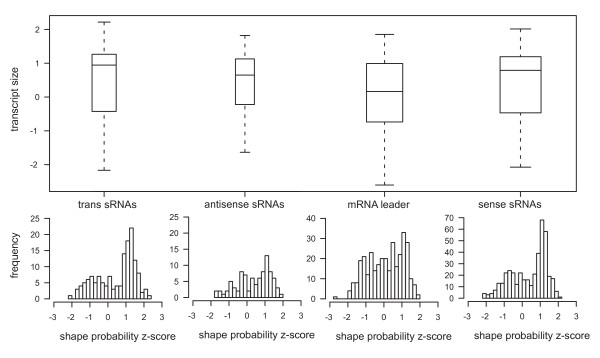
Figure 13.
Z score-distribution. Distribution of Z-scores for dominant shape probabilities in different classes of transcripts. Shape probabilities serve as a measure of the well-definedness of secondary structure, which is independent of GC content. See Methods for details of the Z-score computation. The same data are shown as box plots (indicating median, first quartiles and extremal points) and as histograms. A bias towards positive Z-scores, strongest for trans-encoded sRNAs, and almost zero for mRNA leader transcripts is seen.

