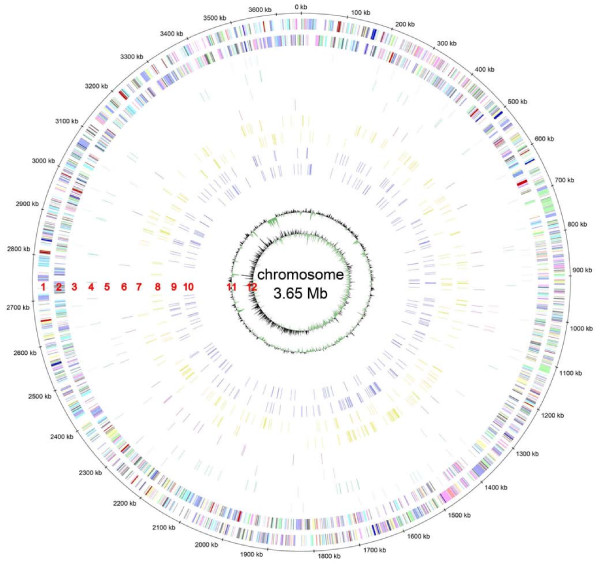
Figure 5.
Genome distribution of sRNA candidates on the chromosome. sRNA candidates are blotted at their genome position. The outer to inner circles show: 1 and 2, protein-encoding genes on the plus and minus strand, respectively; 3 and 4, trans-encoded sRNAs on the plus and minus strand, respectively; 5 and 6, cis-encoded antisense sRNAs on the plus and minus strand, respectively; 7 and 8, sense sRNAs on the plus and minus strand, respectively; 9 and 10, leader mRNA sequences on the plus and minus strand, respectively; 11 and 12, GC plot and GC skew, respectively.

