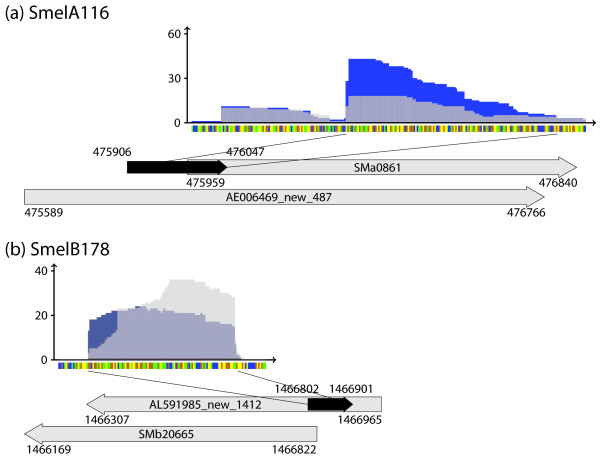
Figure 9.
Examples of sRNAs within transposable elements. Sequence coverage profile: blue and light grey color denote transcript coverages derived from sample 1 and 2, respectively. Dark grey colored areas represent an overlap of coverages from both samples. y- and x-axis represent coverage and sequence, respectively. Sequence code: blue, A; yellow, C; orange, G; green, U. Grey arrows represent genes flanking or overlapping sRNA genes. Black arrows represent the sRNAs. (a) SmelA116 (mRNA leader transcript of SMa0861), (b) SmelB178 (antisense transcript of SMb20665).

