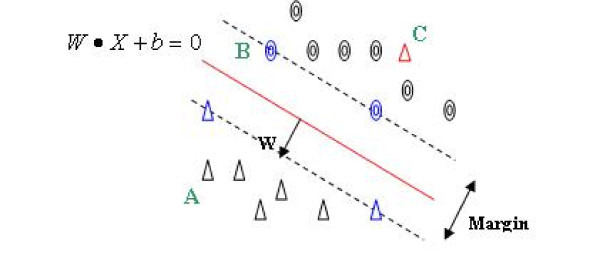
Figure 2.
The hyperplane and the support vectors. The red line is the hyperplane which separates the two classes of samples. The blue points are the support vectors. A is the right classified sample but has less influence on the hyperplane. B is the right classified sample and has influence on the hyperplane. C is the incorrectly classified sample.

