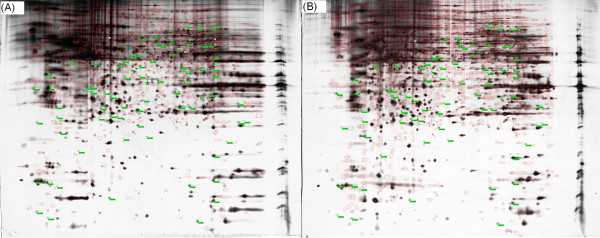
Figure 4.
2-DE reveals protein expression in untreated ARPE-19 cells or ARPE-19 cells exposed to 17-AAG. Isoelectric focusing followed by second-dimension electrophoresis was carried out using protein lysates from ARPE-19 cells incubated with 3 μM 17-AAG or DMSO for 16 h. Gels (three of each) were then silver-stained and scanned, and the resulting images were analyzed using the ImageMaster 2D Platinum software for spot detection, quantification, and comparative and statistical analyses as described in the Methods section. 2-DE reveals protein expression in untreated ARPE-19 cells (A) or ARPE-19 cells exposed to 17-AAG (B). The green labels identify proteins whose expression is altered by a factor of greater than 1.5 in the treated cells.

