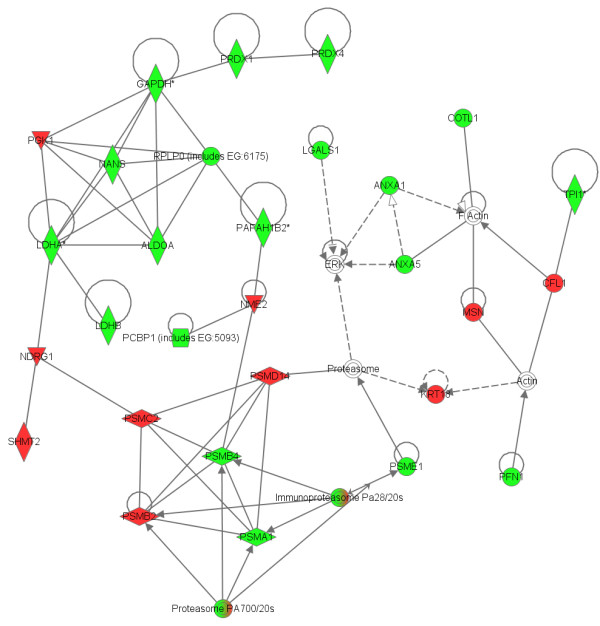
Figure 9.

Network that contains the largest number of differentially expressed proteins. IPA was employed to identify biological networks that were affected by 17-AAG. The 87 unique IPI accession numbers were analyzed for network associations by the Ingenuity Knowledge base and six high ranking networks were identified. The top-ranked network comprises 35 proteins, including 29 that were identified by proteomics and six that were recognized as related to the network because of their reported interactions with the proteins that were identified by difference gel electrophoresis (DIGE). Shaded nodes are derived from dataset of proteins identified by 2D, and white nodes are inserted by the IPA program. Green represents a decrease, while red denotes an increase. Nodes are displayed using various shapes that represent the functional class of the gene product: concentric circles represent a group or complex; down-pointing triangles represent kinases; diamonds represents other enzymes; horizontal ovals represent transcription regulators; vertical ovals represent transmembrane receptors; vertical rectangles represent G-protein coupled receptors; horizontal rectangles represent ligand-dependent nuclear receptors, and circles represent other entities. Solid lines indicate direct interactions between nodes whereas dashed lines represent indirect interactions. Lines beginning and ending at a single node show self-regulation, while a line without an arrowhead represents binding. Arrowheads represent directionality of the relationship.
