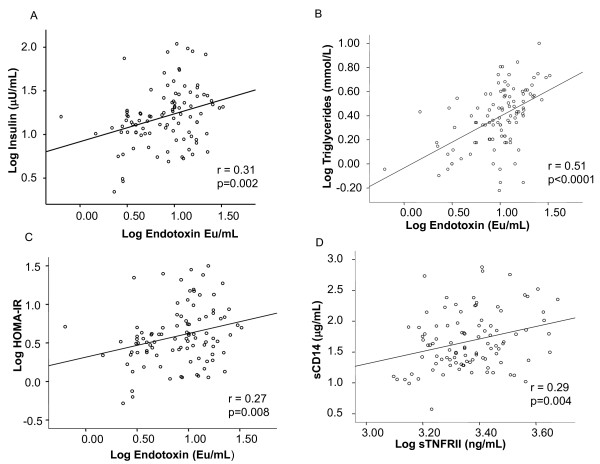
Figure 3.
Correlations between log endotoxin and log fasting insulin, log triglycerides, HOMA-IR, and between sTNFRII and sCD14. The figures show Pearson correlations between log endotoxin (EU/mL) and log fasting insulin (μU/mL) in the whole cohort (A) log triglycerides (mmol/L) in patients with NAFLD (B) log serum levels of endotoxin and HOMA-IR in the whole cohort (C). The lines of best fit are also shown: a) r = 0.31, p = 0.02, b) r = 0.51, p < 0.0001 c) r = 0.27, p = 0.008. A Pearson correlation between log sTNFRII (ng/mL) and sCD14 (μg/mL) in patients with NAFLD is also shown (D). The line of best fit is: d) r = 0.29, p = 0.004.

