Figure 4.
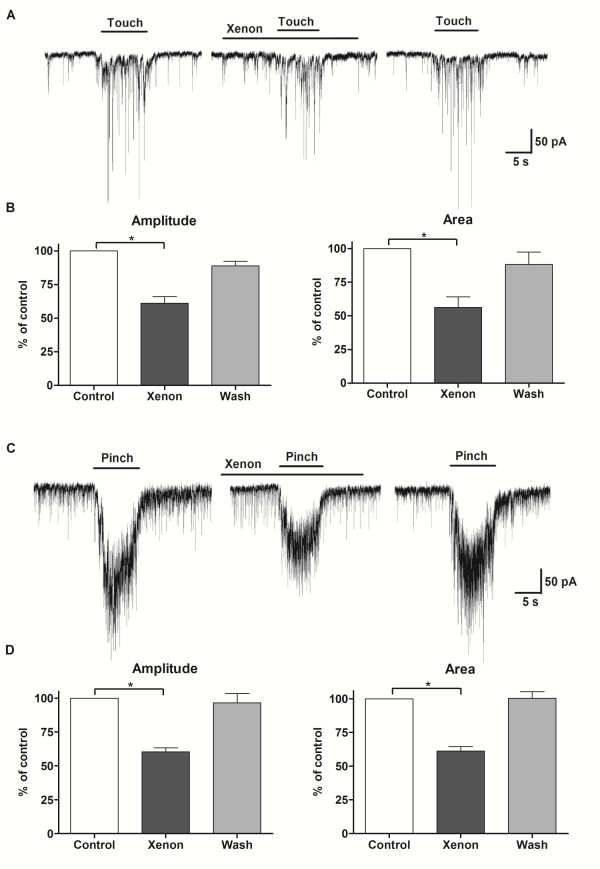
Xenon inhibited the responses to touch and pinch in vivo. A - Representative traces showing the decrease in the response to light touch of the hind limb during xenon application (HP = -70 mV) recorded using in vivo patch-clamp method. B - Diagram showing the reversible decrease in mean amplitude and integrated area of the touch response during xenon application (n = 4). *P < 0.05 compared with control. C - Response to skin fold pinch during xenon application. D - The mean amplitude and integrated area of pinch-evoked EPSCs decreased in the presence of xenon (n = 6). n is the number of neurons.

