
Figure 5.
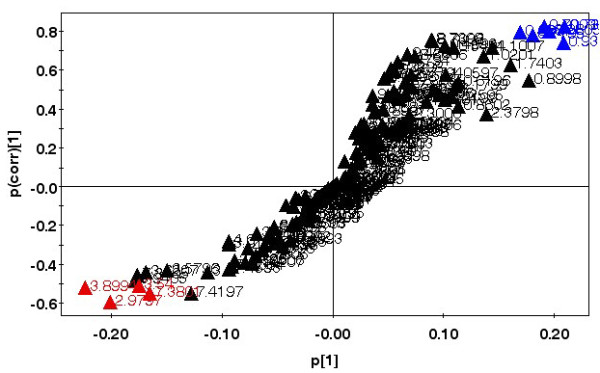
Representative OPLS-DA S-plot showing relative contribution of bins to clustering of uninfected and infected classes. This plot corresponds to scores plot Figure 4C. Red - important bins increased post-infection, Blue - important bins decreased post-infection. Bins with high correlation with class separation (>0.5 for increased, >0.75 for decreased) and high magnitude (>0.15) were selected for further analysis.