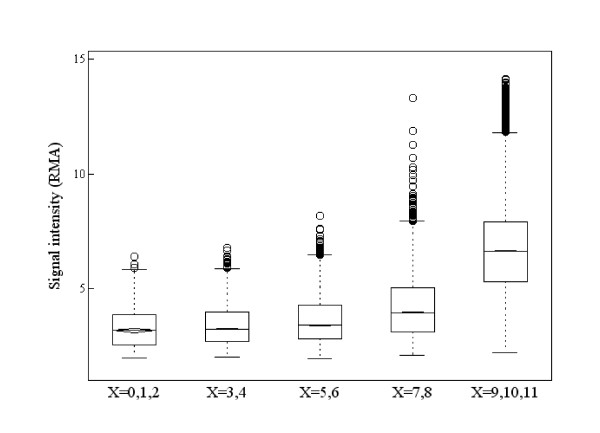
Figure 1.
Parallel boxplots of gene expression levels by RMA graded according to the value of X (number of pairs where PM>MM). A gene with high expression level has a large value of X, but large X does not necessary imply a high expression level; expression level of a gene with large X can vary from low to high.

