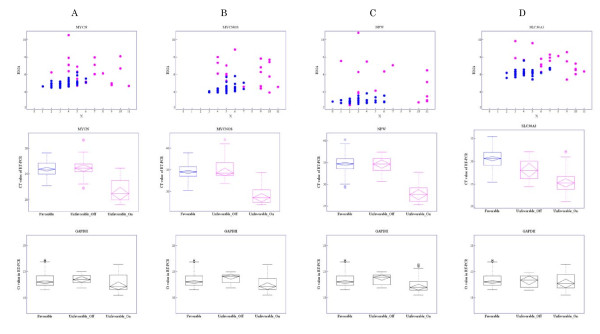
Figure 7.
Gene-expression features assessed by microarray and Ct values in real-time RT-PCR for four unique selected genes. The genes selected were: A: MYCN, B: MYCNOS, C: NPW, and D: SLC30A3. The first row shows scatter diagrams of X versus expression intensities for each case. Pink points represent cases with unfavorable outcome and blue points cases with favorable outcome. The second row shows parallel boxplots of Ct values in real-time RT-PCR by three groups: favorable, unfavorable_On, and unfavorable_Off. The third row shows parallel boxplots of Ct values in real-time RT-PCR of GAPDH for the same three groups.

