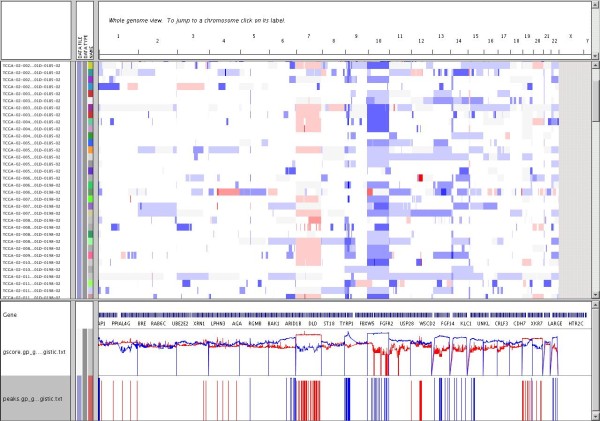
Figure 5.
IGV display of JISTIC results. Segmented copy number and JISTIC results can be simultaneously displayed using the visualization tool IGV [20]. The main window displays the segmented copy number data used as JISTIC input. Two tracks at the bottom show JISTIC's output (G-score and peak regions respectively).

