
Figure 1.
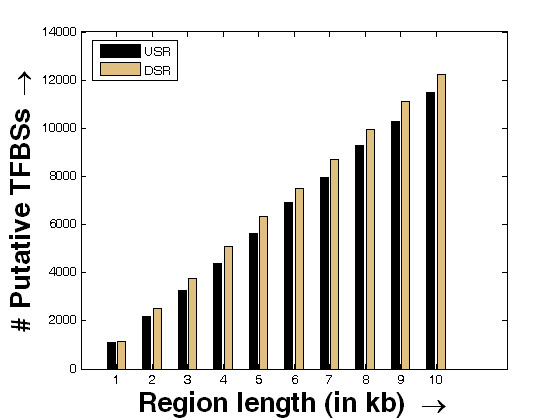
Comparative cumulative distribution of the number of putative TFBSs in the discretized regions of USR and DSR. Comparative cumulative distribution of the number of putative TFBSs (based on the list of TFs found to bind) in the USR and DSR divided into 10 discrete fragments of 1 kb each. The bars in black and metallic gold correspond to the number of total putative TFs binding in the USR and DSR, respectively within the region defined along the x-axis.