
Figure 3.
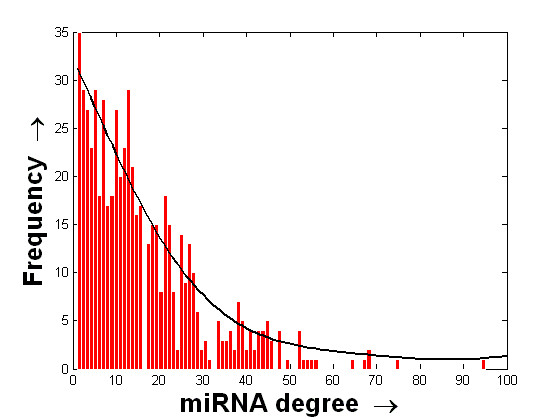
Histogram of the degree values of miRNAs with respect to the TFs binding to their 10 kb USR. Histogram of the degree values of miRNAs with respect to the number of unique putative TFs binding to their 10 kb upstream region. The histogram is shown using the red bars. The distributed values along the x-axis are finally fitted with a curve that is shown in black.