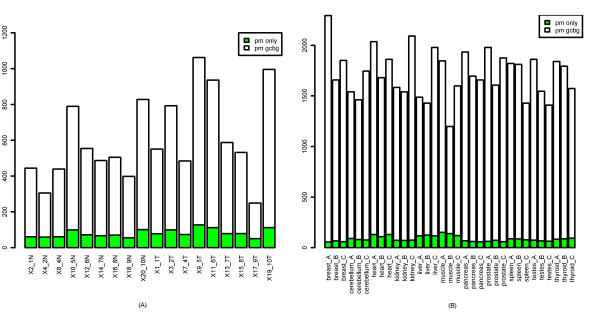
Figure 5.
The expression values of two genes calculated using the iterPLIER algorithm with different background-correction options. The x-axis represents samples and the y-axis represents gene expression values (on a linear scale) (A) Transcript 2623139 in the colon cancer dataset (B) Transcript 3190762 in the human tissue dataset.

