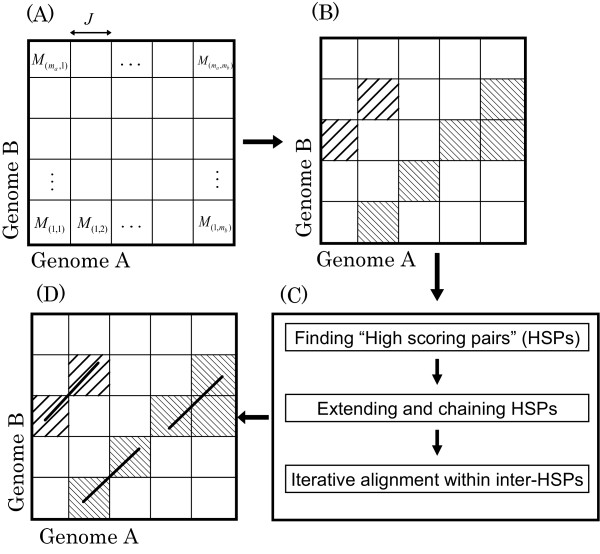
Figure 1.
The flow of the Cgaln algorithm. J indicates the length of a block. Mx,y indicates the similarity score between blocks. (A) and (B) show the block-level alignment, (C) shows the flow of nucleotide-level alignment, and (D) shows the alignment result. The cells with oblique lines indicate aligned block cells, and the diagonal lines in (D) indicate the aligned subsequences at the nucleotide level.

