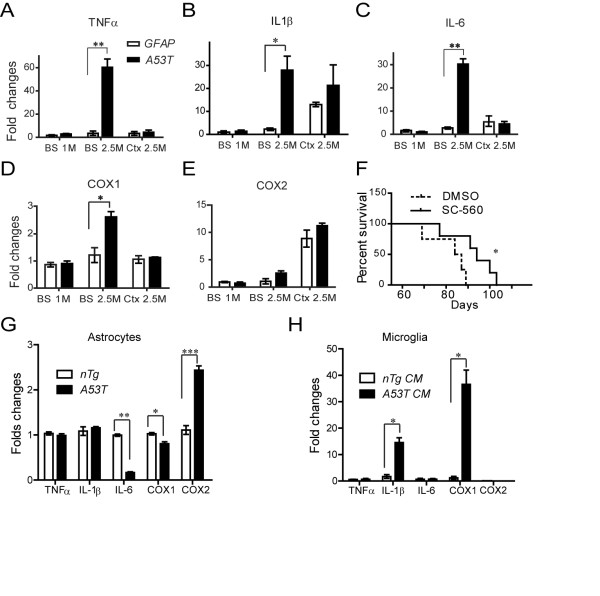
Figure 7.
Increase of inflammatory response in A53T mice. (A-E), Quantitative PCR array analysis of the expression of cytokines in the tissues of the brainstem (BS) and cerebral cortex (Ctx) of A53T mice at asymptomatic (1 M) and symptomatic (2.5) stages (n = 3 per genotype and per stage). *p < 0.05, **p < 0.01. (F), Survival curve shows the lifespan of A53T mice treated with COX-1 inhibitor, SC-560 (n = 5) or 40% vehicle, DMSO (n = 4). Log-rank test, *p < 0.05. (G), Quantitative PCR array analysis of the expression of cytokines in cultured astrocytes from the brainstem of A53T or nTg mice (n = 3 per genotype). *p < 0.05, **p < 0.01, ***p < 0.001. (H), Quantitative PCR array analysis of the expression of cytokines in the cultured primary microglia treated with conditioned medium from cultured astrocytes of the brainstem of A53T or nTg mice (n = 3 per genotype). *p < 0.05.

