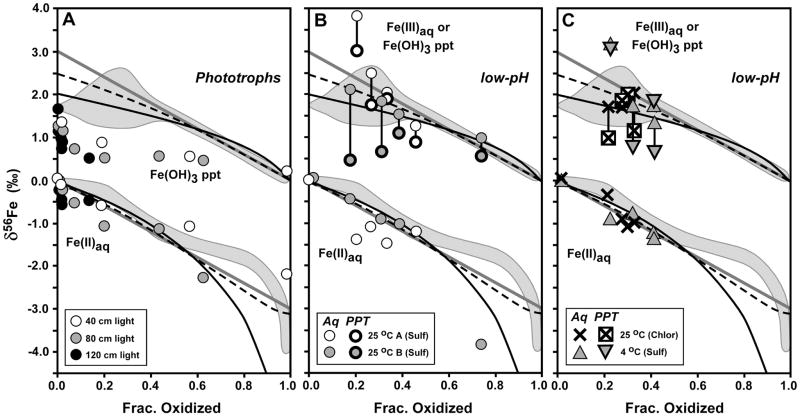
Fig. 5.
Comparison of Fe isotope variations of the current study (grey fields, from Fig. 4) with phototrophic Fe(II) oxidation (panel A, from Croal et al., 2004) and low-pH Fe(II) oxidation (panels B and C, from Balci et al., 2006). δ56Fe values normalized to a system value of zero for all studies to allow direct comparison. Reference curves shown from Fig. 4 for a) Rayleigh fractionation using a net Δ56FeFe(OH)3 – Fe(II)aq fractionation of +2 ‰ (black curve), b) the Rayleigh fractionation curve modified to account for partial isotopic re-equilibration (dashed black curve), and c) closed-system equilibrium fractionation for Δ56FeFe(OH)3 – Fe(II)aq = +3 ‰ (straight grey line). For low-pH experiments of Balci et al. (2006) (panels B and C), δ56Fe values for aqueous Fe(III) and Fe(II) shown with thin line for symbols, and δ56Fe values for ferric hydroxide precipitates shown with thick line for symbols.

