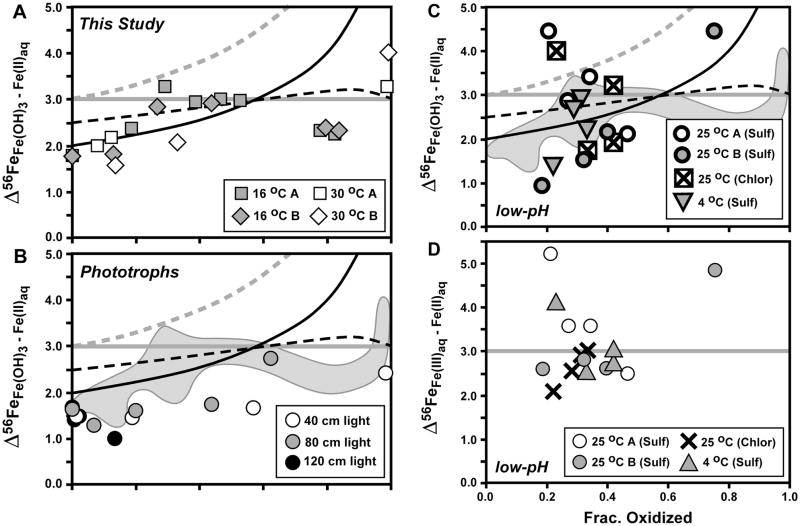
Fig. 6.
Comparison of isotopic fractionations between ferric hydroxide precipitate (Fe(OH)3) and Fe(II)aq (panel A: current study (Table 1); panel B: study of Croal et al., 2004; panel C: study of Balci et al., 2006), as well as between Fe(III)aq and Fe(II)aq from the study of Balci et al. (2006) (panel D). Reference curves for panels A–C shown from Figs. 4 and 5 for Rayleigh fractionation using a net Δ56FeFe(OH)3 – Fe(II)aq fractionation of +2 ‰ (black curve), the Rayleigh fractionation curve modified to account for partial isotopic re-equilibration (dashed black curve), and closed-system equilibrium fractionation for Δ56FeFe(OH)3 – Fe(II)aq = +3 ‰ (straight grey line). In addition, a Raleigh curve for an equilibrium Δ56FeFe(III)aq – Fe(II)aq fractionation of +3 ‰, followed by quantitative sequestration of Fe(III)aq to Fe(OH)3, is shown in grey dashed line (panels A–C). Reference curve for closed-system equilibrium fractionation for Δ56FeFe(III)aq – Fe(II)aq = +3 ‰ (straight grey line) shown for panel D. Grey field in panels B and C shows outline of data from panel A.

