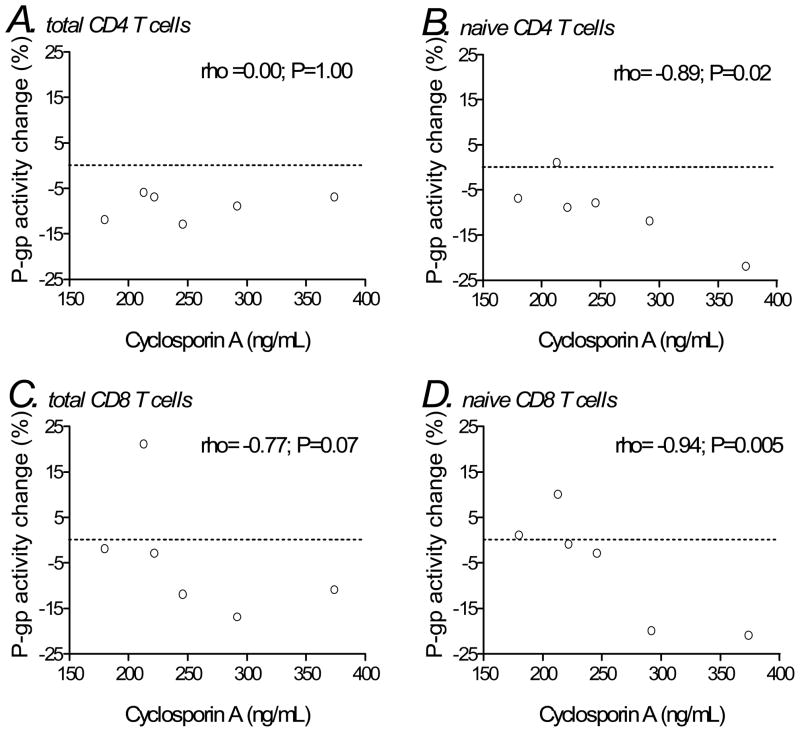
Figure 3.
Associations between P-glycoprotein activity (change from baseline to week 14) and plasma trough cyclosporin A concentrations at day 14 in T cell subsets among individuals in the cyclosporin A arm. Panels represent total CD4 T cells (A), naïve CD4 T cells (B), total CD8 T cells (C), and naïve CD8 T cells (D). Correlation coefficients (rho) and P-values shown are for Spearman correlations. The horizontal dotted lines represent no change in P-glycoprotein activity from baseline.
ART = antiretroviral therapy; CsA = cyclosporin A; P-gp = P-glycoprotein.

