Fig. 4.
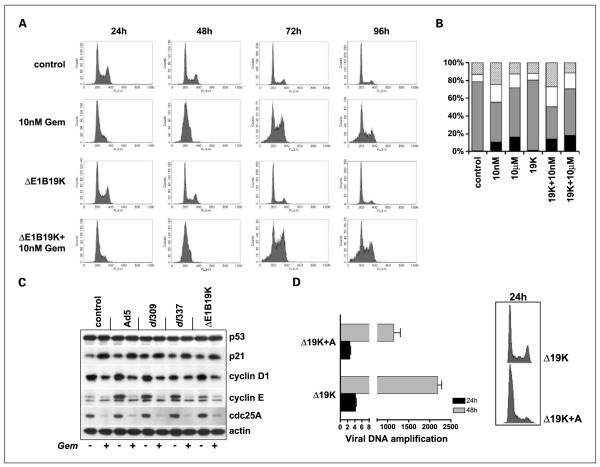
Cell cycle analysis of PT45 cells in the presence of viral mutants and gemcitabine. A, flow cytometric analysis of cells treated with gemcitabine at 10 nmol/L, the Ad5ΔE1B19K mutant alone or in combination. Cells were fixed and stained with propidium iodide 24, 48, 72, and 96 h after treatment. B, histograms illustrating the cell cycle-phase distribution in percentages in response to combination treatments with 10 nmol/L or 10 μmol/L gemcitabine and the ΔE1B19K mutant 96 h after treatment; sub-G1 (black), G1 (grey), S (white), and G2/M (top light grey). C, immunoblot of changes in expression levels of cell cycle related proteins in response to mutants and gemcitabine (10 nmol/L) combinations. Cells were harvested 72 h after treatment. D, cells were serum-starved and treated with aphidocholine (5 μg/mL) for 24 and 48 h followed by viral DNA (hexon) amplification (left panel); right, the corresponding cell cycle diagram 24 h after addition of aphidocholine. Gene amplification was normalized to input virus (3 h after infection); data are representative of three studies.

