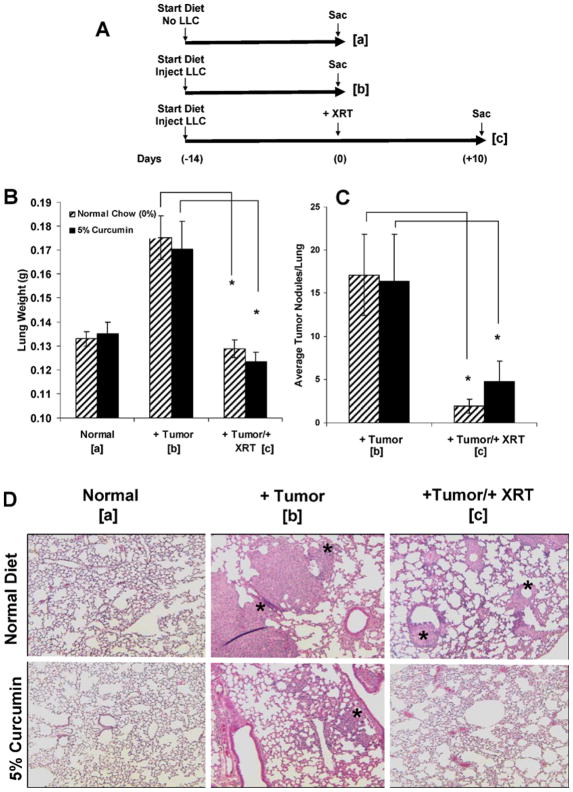
FIG. 6.
Effects of curcumin on lung tumor growth after irradiation. Panel A: Experimental plan. Panel B: Lung weights (mg). Panel C: Nodule counts. Results are findings from two experiments. Panel D: Representative histological profiles of paraffin-embedded lung sections stained with H&E in each cohort. Original magnification 1003. Asterisks represent tumor nodules. *P < 0.02 (panel B) and *P < 0.05 (panel C) for mice in cohort b compared to cohort c (i.e., irradiated compared to nonirradiated) for each diet (0% or 5% curcumin).

