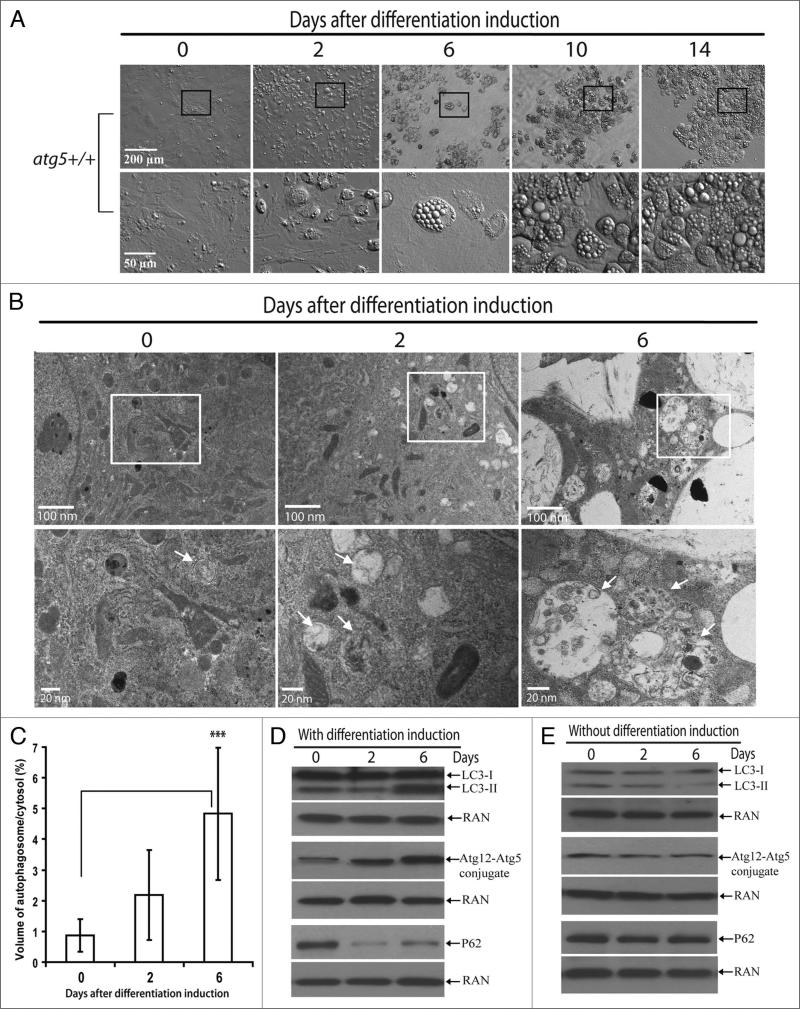
Figure 1.
Autophagy was activated in wild-type MEFs during adipogenesis. (A) Primary atg5+/+ MEFs were induced for adipogenesis. At indicated time points, the progress of differentiation was analyzed. Cells were observed under microscope (Olympus IX70) equipped with relief contrast objectives (10X and 40X, for low and high magnification, respectively). Selected regions in pictures of low magnification (within the squares) are shown below with high magnification. (B) Electron microscopy analysis of primary atg5+/+ MEFs 0, 2 or 6 days after differentiation induction, as indicated. Upper panel shows micrographs of low magnification, and the lower panel shows high magnification of the selected regions (square) in the upper panel. Arrows indicate autophagosomes. (C) Ratio of the volume of autophagosomes to cytosol. The volume of autophagosomes and cytosol were determined by point counting of 15–20 micrographs of cells 0, 2 or 6 days after differentiation induction, as indicated. ***p < 0.001. Student t-test. (D and E). Immunoblotting assays of differentiating cells. The cells at indicated time points with (D) or without (E) differentiation induction were harvested and immunoblotting assays were performed with LC3, Atg12, p62 or RAN antibodies, as indicated. The levels of RAN served as a loading control. The data are representative results from three independent experiments.

