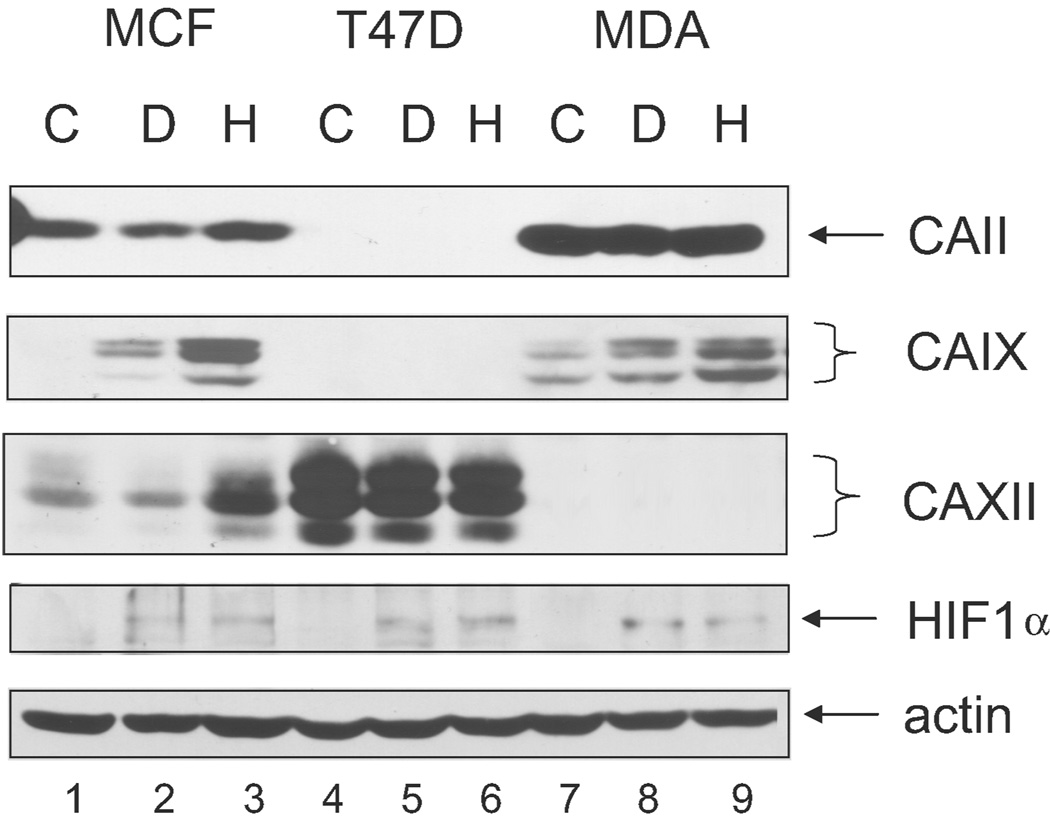
Figure 3.
Expression of CA protein in human breast cancer lines. Confluent cells were exposed to DFO or hypoxia as in Figure 2 and then lysed. Equal protein (100 µg) was analyzed by western blot analysis using the M75 monoclonal antibody. Identical results were obtained in independent duplicate experiments. MCF = MCF10A cells; T47D = T47 D cells; MDA = MDA-MB-231 cells; C = control; D = DFO; H = hypoxia.

