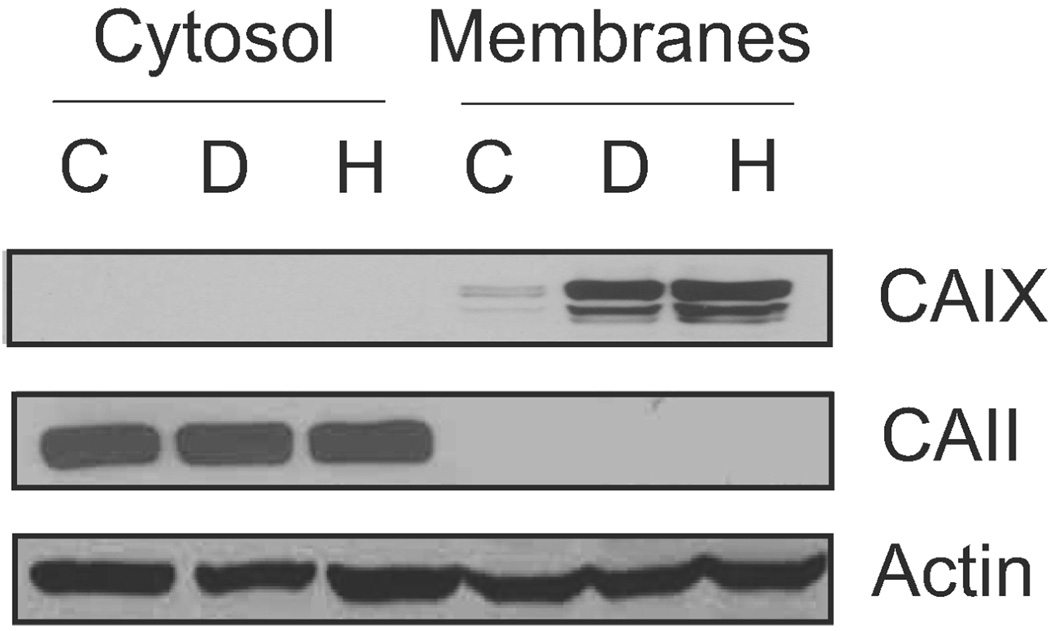
Figure 5.
Expression and localization of CAIX. Confluent MDA cells were collected and separated into total membrane and cytoplasmic fractions after exposure or not to DFO or hypoxia. Equal protein was analyzed by western blot analysis for CAIX (using the M75 monoclonal antibody), CAII, and actin expression. C = control; D = DFO; H = hypoxia. These data represent two independent experiments.

