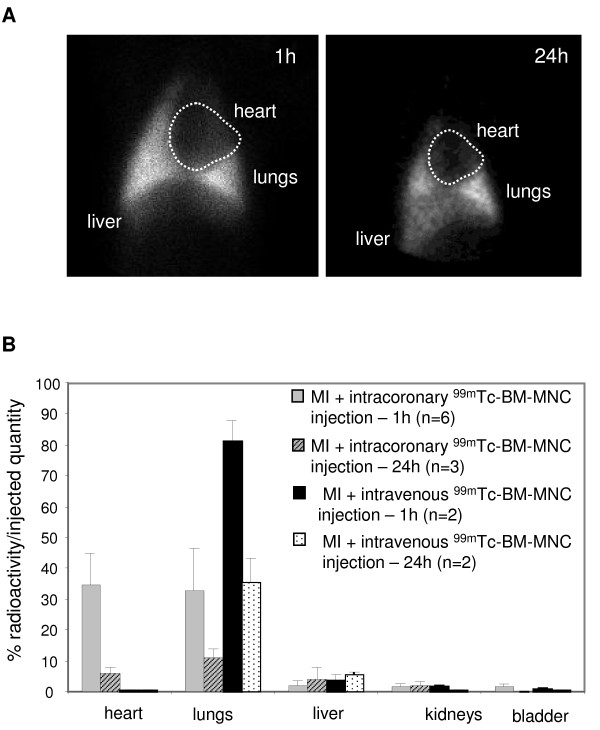
Figure 4.
99mTc-BM-MNC biodistribution according to delivery route. A: Scintigraphic acquisition images, 1 hour and 24 hours after peripheral intravenous 99mTc-BM-MNC injection in the same pig with myocardial infarction. B: Radioactivity quantification, calculated by dividing organ radioactivity with the total injected quantity after radioactive decay correction. Bars indicate mean and SD.

