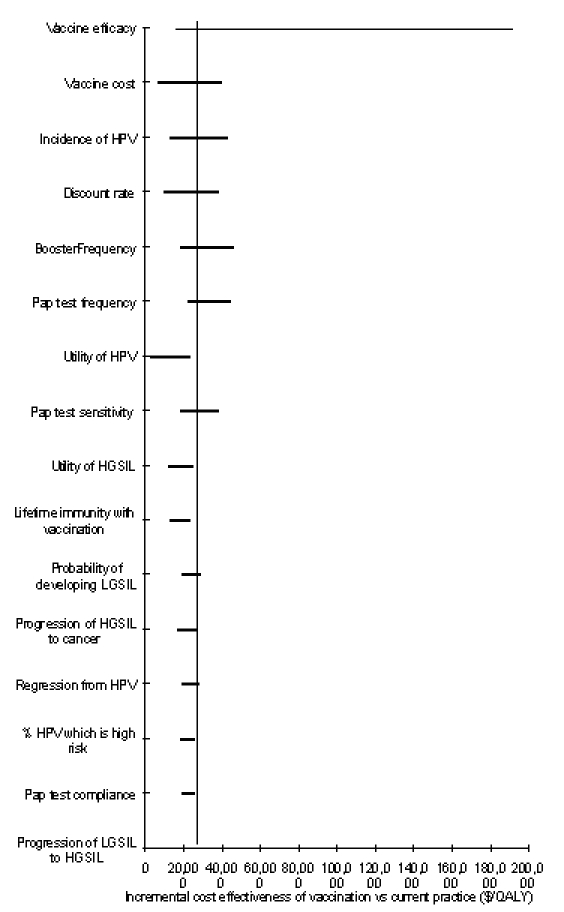
Figure 2.

Sensitivity analysis. Tornado diagram representing the incremental cost-effectiveness ratios of one-way sensitivity analysis on the vaccination strategy compared to current practice. The vertical line represents the incremental cost-effectiveness ratio under base-case conditions.
