
Figure 1.
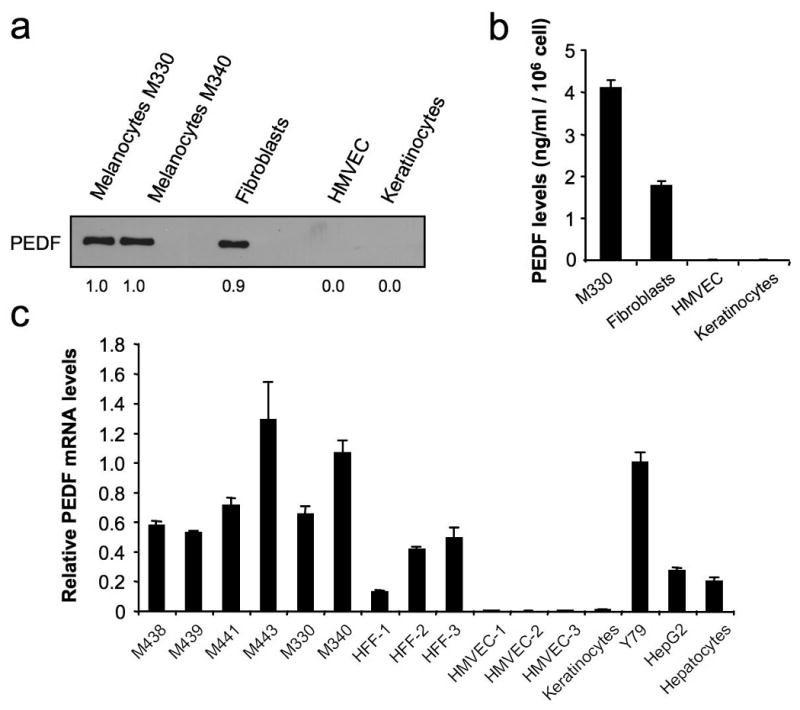
PEDF expression in primary cultures of skin cell types. (a) Western blot analysis of PEDF protein levels in 48 h-conditioned media (CM) from human primary cultures of melanocytes (M330 and M340), fibroblasts, human microvascular endothelial cells (HMVEC) and keratinocytes. Numbers below blot show densitometry values normalized to melanocytes expression. (b) ELISA analysis of secreted PEDF protein levels in 24 h-CM from human primary cultures of melanocytes (M330), fibroblasts, HMVEC and keratinocytes. Bars represent average ± standard deviation (SD). (c) Quantitative RT-PCR analysis of PEDF mRNA levels in human primary cultures of melanocytes (M438, M439, M441, M443, M330, M340), fibroblasts (HFF1, HFF2, HFF3), endothelial cells (HMVEC1, HMVEC2, HMVEC3), keratinocytes, Y79 retinoblastoma cell line, HepG2 hepatocarcinoma cell line and hepatocytes. PEDF mRNA levels are shown relative to Y79 after normalization to 18S rRNA. Bars represent average ± SD.