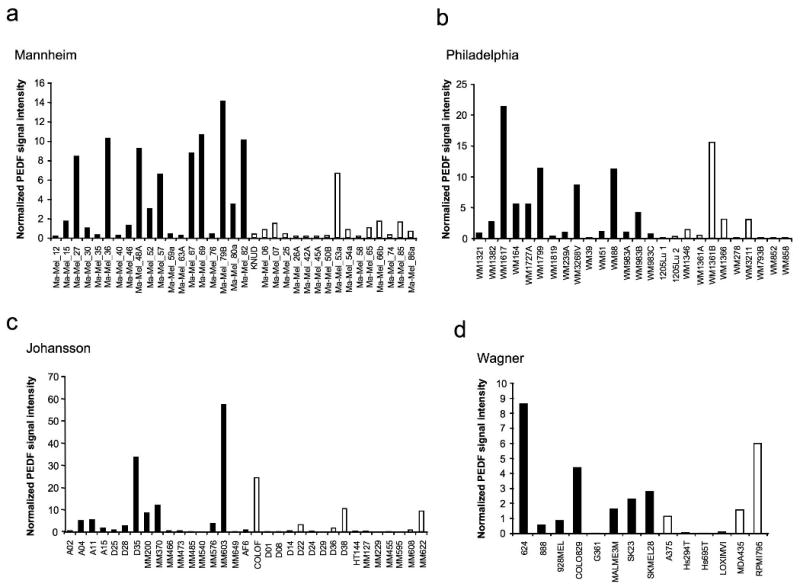
Figure 3.

PEDF expression in series of melanoma cell lines from microarray studies. Analysis of PEDF expression utilizing microarray gene expression data of Mannheim (a), Philadelphia (b), Johansson (c) and Wagner (d) series of melanoma cell lines. Cell lines were classified by their gene signature into weakly (filled bars) and strongly invasive (empty bars) cohorts as described in Supplementary Methods. Normalized PEDF signal intensity is plotted across the sample set. Average and SD values and statistical significance are described in Table 1b.
