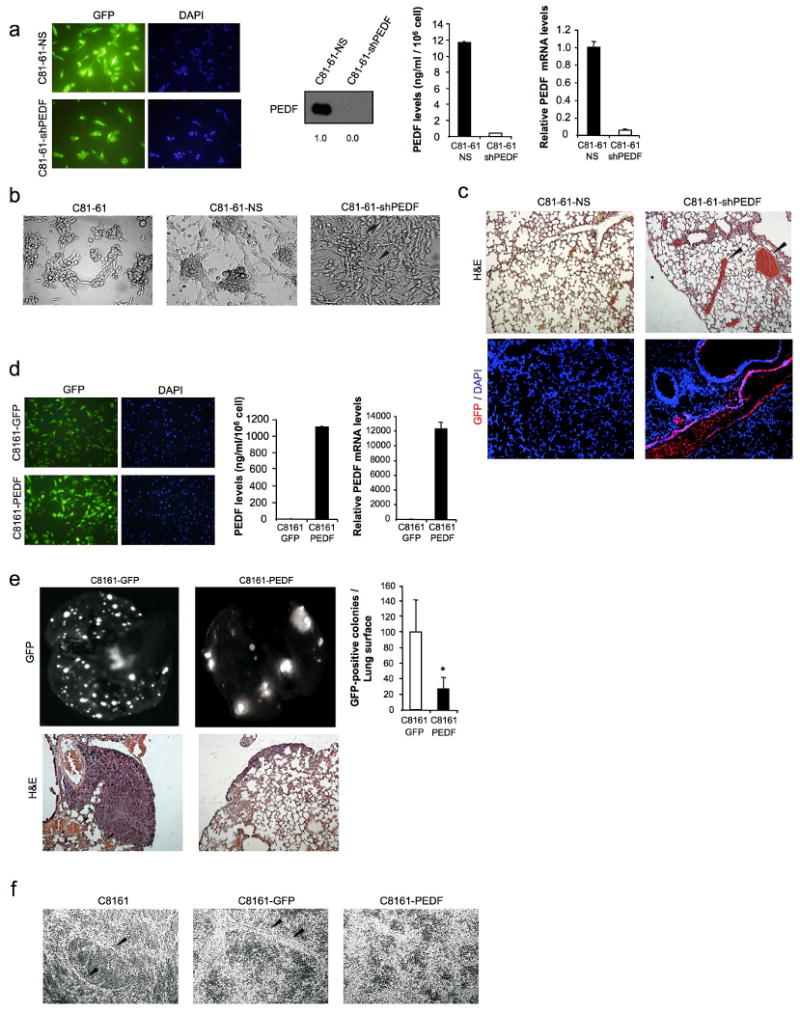
Figure 6.

PEDF interference increases melanoma vasculogenic mimicry. (a) Transduction efficiency of C81-61 melanoma cell line after infection with non-silencing (NS) or shRNAmir to PEDF (shPEDF) lentivirus at a MOI of 40. Fluorescence images show more than 95% GFP-positive cells. Nuclei were visualized by DAPI staining (left panels). Immunoblotting analysis of secreted PEDF protein levels in 48 h-CM from C81-61-NS and C81-61-shPEDF melanoma cell lines. Numbers below blot show densitometry values normalized to C81-61-NS expression (middle left panel). ELISA analysis of secreted PEDF protein levels in 48 h-CM from C81-61-NS and C81-61-shPEDF melanoma cell lines. Bars represent average ± SD (middle right panel). Quantitative RT-PCR analysis of PEDF mRNA levels in C81-61-NS and C81-61-shPEDF melanoma cell lines. PEDF mRNA levels are shown relative to C81-61-NS after normalization to GAPDH. Bars represent average ± SD (right panel). (b) In vitro vasculogenic mimicry assay of C81-61, C81-61-NS and C81-61-shPEDF melanoma cell lines. Black arrows point to cord-like structures suggestive of vasculogenic mimicry in C81-61-shPEDF cells. (c) Formation of vasculogenic-like networks in vivo by C81-61-shPEDF melanoma cells. H&E staining of lung sections from C81-61-NS- and C81-61-shPEDF-injected mice. Vessel-like structures and blood-filled lacunae (pointed by arrows) were detected in lungs from mice inoculated with C81-61-shPEDF cells (top). Immunofluorescence staining for GFP (red) and DAPI (blue) counterstaining are shown (bottom). (d) Transduction efficiency of C8161 melanoma cell line after infection with control (GFP) or PEDF-over-expressing (PEDF) lentivirus at a MOI of 10. Fluorescence images show more than 95% GFP-positive cells. Nuclei were visualized by DAPI staining (left panels). ELISA analysis of secreted PEDF protein levels in 48 h-CM from C8161-GFP and C8161-PEDF melanoma cell lines. Bars represent average ± SD (middle panel). Quantitative RT-PCR analysis of PEDF mRNA levels in C8161-GFP and C8161-PEDF melanoma cell lines. PEDF mRNA levels are shown relative to C8161-GFP after normalization to GAPDH. Bars represent average ± SD (right panel). (e) Lung colonization assay of C8161-GFP and C8161-PEDF melanoma cell lines. Lung metastases were visualized by fluorescence imaging. Fluorescence images of the lungs (top, left) and quantification of surface metastases (top, right) are shown. Bars represent average ± SD, and statistical significance was determined by Student's t-test (*, p<0.05). Bottom panels show H&E staining of lung sections. Vessel-like structures in lungs of mice inoculated with C8161-GFP cells are indicated by arrows. (f) In vitro vasculogenic mimicry assay of C8161, C8161-GFP and C8161-PEDF melanoma cell lines. Cord-like structures in C8161 and C8161-GFP cell cultures are indicated by arrows.
