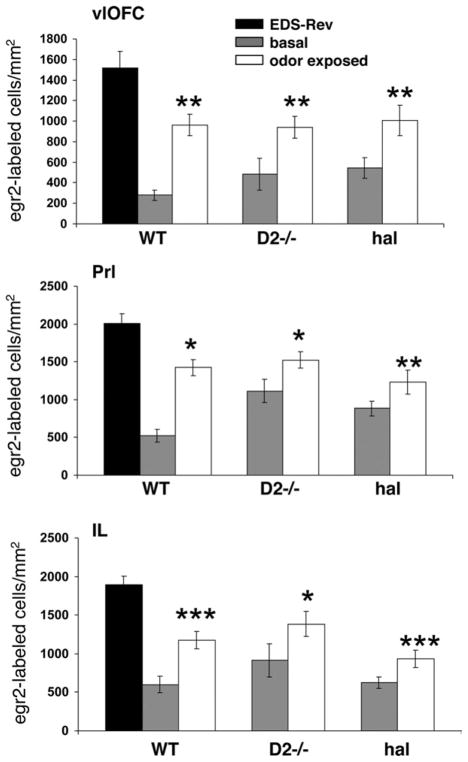
Fig. 6.
Densities of egr-2-labeled cells in the vlOFC and IL/PrL subregions of the mPFC in EDS-Rev-tested wild type compared with the densities of egr-2-labeled cells in these regions in D2 mutants and haloperidol-treated wild type at baseline and after odor exposure. Data are means ± SEM of determinations made from five to seven animals per group. Statistical differences revealed by ANOVA were resolved post hoc (Tukey–Kramer multiple comparisons) as indicated. * P<0.05, ** P<0.01, ***P<0.001.

