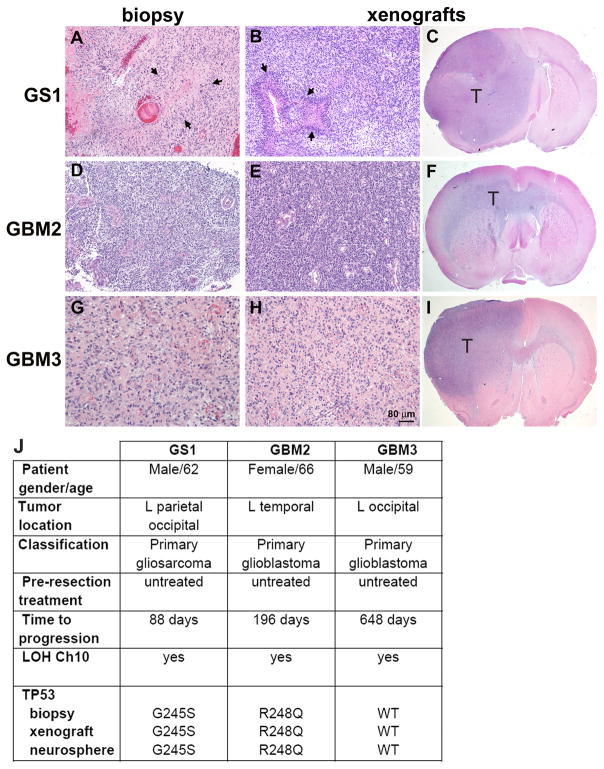
Figure 3.
Orthotopic xenografts generated by GS1 and GBM neurospheres phenocopy the parental tumors. Tumor biopsy samples and rat brains implanted with the respective neurosphere cultures were formalin fixed and paraffin embedded, sectioned and stained with H&E. Representative images are shown for GS1 biopsy (A) and corresponding xenograft (B,C), where arrows point to pseudopalisading necrosis. Representative images are also shown for primary GBM samples GBM2 (D), and corresponding xenografts (E,F), and GBM3 (G) and corresponding xenografts (H,I). “T” indicates tumor in the 10× magnification images (C,F,I). Scale, 80 μm (A,B,D,E,G,H). J) Patient information and molecular analysis of the tumor biopsies.

