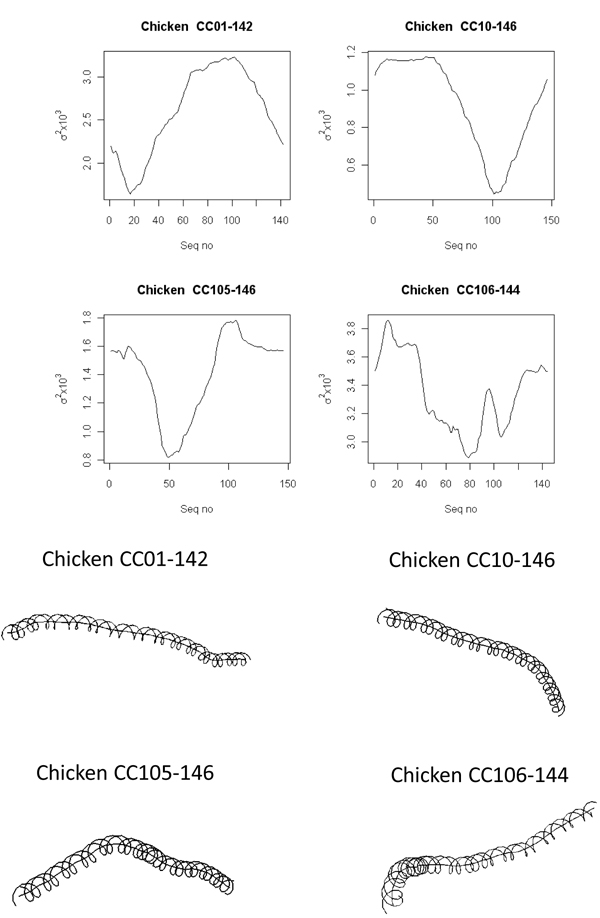
Figure 4.
The upper panel depicts the curvature dispersion The upper panel depicts the curvature dispersion σ2 associated with chicken nucleosome calculated by cyclically permuting the sequences using the theoretical model proposed by De Santis et al [46]. The lower panel is the DNA path calculated for those sequences.

