Abstract
The addition of accurate system modeling in PET image reconstruction results in images with distinct noise texture and characteristics. In particular, the incorporation of point spread functions (PSF) into the system model has been shown to visually reduce image noise, but the noise properties have not been thoroughly studied. This work offers a systematic evaluation of noise and signal properties in different combinations of reconstruction methods and parameters. We evaluate two fully-3D PET reconstruction algorithms: (1) OSEM with exact scanner line of response modeled (OSEM+LOR), (2) OSEM with line of response and a measured point spread function incorporated (OSEM+LOR+PSF), in combination with the effects of 4 post filtering parameters and 1-10 iterations. We used a modified NEMA IQ phantom, which was filled with 68Ge and consisted of 6 hot spheres of different sizes with a target/background ratio of 4:1. The phantom was scanned 50 times in 3D mode on a clinical system to provide independent noise realizations. Data were reconstructed with OSEM+LOR and OSEM+LOR+PSF using different reconstruction parameters. With access to multiple realizations, 4 metrics are adopted to quantify the noise characteristics in the reconstructed images. Image roughness and the standard deviation image are measures of the pixel-to-pixel variation, while NEMA and ensemble noises quantify the region-to-region variation. In addition to 4 noise metrics, we also evaluate signal to noise performance with accepted signal strength measures (recovery coefficient, SNR for quantitation), and study the relations between different metrics. From the analysis results, a linear correlation is observed between NEMA noise and ensemble noise for all different combinations of reconstruction methods and parameters, suggesting that NEMA style noise is a reasonable surrogate for ensemble noise when multiple realizations of scans are not available in practice. At the same number of iterations, the addition of PSF reduces image roughness for unfiltered images by roughly 35%, while the addition of PSF does not reduce NEMA style or ensemble noise. When noise is measured across realizations, the PSF based method offers slightly improved ( 7%) signal to noise performance across a range of reconstruction parameters.
I. Introduction
QUANTITATION in PET has significant implications in monitoring treatment and progression of disease. Numerous efforts have demonstrated image quality improvements with iterative reconstruction methods [1], and further improvement can be achieved when the full physics of the imaging process is accurately and precisely modeled. Several works reconstruct directly from the raw coincidence line-of-response (LOR) data without any pre-processing [2], [3], and are called the LOR-based algorithms. The Poisson statistics of the measurements are preserved in these algorithms, and the full benefit of maximum-likelihood (ML) reconstruction is achieved. One important component of the physics modeling is the detector point spread function (PSF), which could be obtained through analytical derivations [4], Monte Carlo simulations [1], [5] or experimental measurements [6]. Modeling of the detector PSF during fully 3D iterative reconstruction has been shown to improve the spatial resolution, and to visually reduce noise in the reconstructed images. However, the noise properties of the PSF based reconstruction algorithms have not been thoroughly evaluated.
In this work, we present a systematic evaluation of noise and signal properties in different combinations of reconstruction methods and parameters for 3D PET image reconstruction. We evaluate two algorithms: OSEM+LOR (OSEM with exact locations of the line of response modeled) and OSEM+LOR+PSF (OSEM+LOR with point spread function modeled), in combination with the effects of 4 post-reconstruction filtering parameters and up to 10 iterations. The OSEM+LOR implementation matches the vendor's product reconstruction and data corrections (randoms, scatter, deadtime, efficiency, etc.) methods, providing insight into actual system performance. The evaluation is based on 50 independent realizations of measured phantom data. We adopt 4 metrics to quantify the background noise properties, and 4 metrics to evaluate the signal and noise characteristics in features. We assess the performance of the two reconstruction algorithms, as well as how different reconstruction parameters affect the noise properties. The relations between various metrics are also studied over a range of reconstruction parameters.
II. Methods
A. Phantom Experiments
We used a modified NEMA NU-2 IQ phantom in the study, which contained 6 hot spheres with inner diameters of 10, 13, 17, 22, 28 and 37 mm. Phantom spheres and background volumes were filled with long half-life 68Ge solid epoxy, with a fixed target/background ratio of 4:1. The phantom was scanned on a Discovery-STE (DSTE) PET/CT scanner (GE Healthcare) operated in 3D mode. 50 independent acquisitions (each scan for 5 min) of the phantom were obtained, with each data set having roughly 85 million prompts.
B. Image Reconstruction
All 50 scans were reconstructed with OSEM+LOR and OSEM+LOR+PSF algorithms. The specific implementation of OSEM+LOR algorithm is derived from the work of Manjeshwar et al. [7] and reconstructs using angular subsets and all oblique planes from the fully 3D data (no axial mashing). For the OSEM+LOR+PSF algorithm, the scanner PSF models the detector blurring as a 2-D system response function, which blurs in radial direction and is variant in radial position. The PSF is obtained through experimental measurement with a non-collimated point source [8].
Each reconstruction was run to 10 iterations with 28 subsets for each iteration, and the results of each iteration were saved. After the reconstruction step, different post smoothing filters were applied to the reconstructed images. The images either had no post-reconstruction smoothing applied, or were convolved with 4 mm, 7 mm and 10 mm 2D Gaussian filters. To match the vendor's product implementation, the same smoothing in the axial direction was also included for each Gaussian filter by performing a weighted average of adjacent image slices.
Finally, the reconstruction and processing steps produced a series of reconstructed images with different combinations of reconstruction methods and parameters: 2 reconstruction methods × 4 levels of post-reconstruction filters × 10 iterations × 50 realizations, for a total of 4000 image volumes. Different image figures of merit (FOMs) are adopted to evaluate the noise characteristics for the two reconstruction methods and various reconstruction parameters.
C. Noise Properties in Background
With access to multiple acquisitions of the phantom, we use four image FOMs: image roughness, ’NEMA style’ noise, ensemble noise, and the standard deviation image, to quantify the background noise characteristics. The relations between these FOMs are also studied.
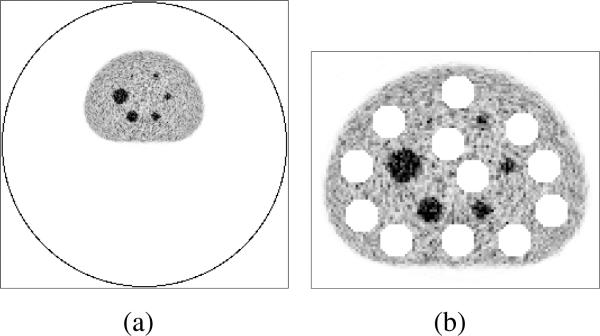
To calculate the noise metrics, one image slice containing all the 6 hot spheres (shown in Figure 1(a)) was selected as the target slice for analysis. 2D ROIs over slices suggested in NEMA NU-2 instructions [9] were used in our work. We positioned 12 background 2D ROIs on the target slice, as well as on 4 neighboring slices (slices ± 13 mm and ± 26 mm away), for a total of 60 background ROIs for each ROI size. 6 different ROI sizes were used, and the ROI diameters were equal to the physical inner diameters of the hot spheres. Figure 1(b) shows the 37 mm diameter ROIs overlaid on the target slice.
Fig. 1.
(a): Example of one transaxial slice of reconstructed image (recon=LOR, PF=none, iter=5, realization = 1), with the black circle denoting the scanner field of view; (b): NEMA background ROIs (denoted by white spheres) overlaid on a zoomed transaxial slice.
The noise metrics are defined and calculated as follows.
Image roughness (IR) Image roughness measures the pixel to pixel variability in the image, and could be calculated for a single realization. For each realization, we first calculate the coefficient of variation (COV) of the pixel values in each ROI, and then average the values over 60 ROIs to generate the final image roughness measure. Since image roughness is defined for each realization, we could further calculate its mean and standard deviation across different realizations.
NEMA noise (NN) NEMA style noise is a measure for background variability proposed in the NEMA NU-2 instructions [9]. We first calculate the ROI average for each of the 60 ROIs. Then for one realization, the COV of the ROI means across the 60 ROIs is defined as the NEMA noise. As this metric is defined for each realization, we could compute its variation across realizations when multiple realizations are available.
Ensemble noise (EN) Ensemble noise is a measure for noise across independent realizations, and it is inversely proportional of detection task performance. For each ROI size, it is defined as the COV of ROI means across the 50 realizations, and we further average this value over ROIs to generate the final ensemble noise measure. This metric can only be computed when multiple realizations are available.
Standard deviation image For each pixel in the target slice, we calculate the sample standard deviation across different realizations, and generate the standard deviation image. The standard deviation image is defined for each pixel of the slice (not restricted to background pixels), and it offers an effective way to compare noise standard deviation (or variance) in different reconstruction methods and parameters.
Among the four metrics defined above, ensemble noise and the standard deviation image are based on reconstruction results from different realizations, and are often considered to be closely related to the ”true” noise which most accurately represents the uncertainties in the images. However, as multiple realizations of acquisitions are usually not available in many cases, metrics defined on a single realization, like image roughness and NEMA style noise, are more often used to quantify the noise characteristics. While these two metrics have been used extensively in the literature to assess the performance of different reconstruction algorithms or different imaging system configurations, their relation has not been properly studied, and in particular, how these metrics relate to the ensemble noise is not clear. Therefore, we also analyze the relations between different metrics.
The possible dimensions of variations for the metrics include: 2 reconstruction methods × 4 levels of post-reconstruction filters × 6 ROIs sizes × 10 iterations × 50 realizations.
D. Signal and Noise Properties in Features
We evaluated several signal strength metrics to assess signal versus noise performance with different reconstruction methods and parameters. The following metrics are used in the analysis of signal and noise properties in hot spheres.
Contrast recovery coefficient of mean value (CRCmean) For one realization, CRCmean is defined as the average activity of each hot sphere divided by the true activity.
Contrast recovery coefficient of maximum value (CRCmax) CRCmax is defined for each realization as the maximum value of each hot sphere divided by the true activity.
Ensemble noise in hot spheres (ENHS) Ensemble noise is calculated for each hot sphere in the same way as in background noise analysis.
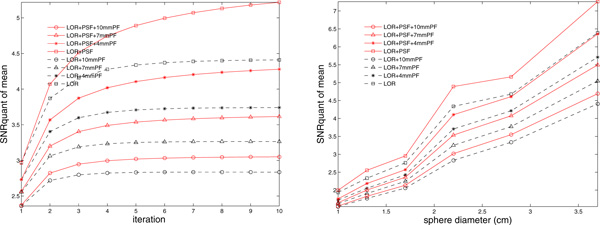
- Signal to noise ratio for quantitation (SNRquant) SNRquant, a measure of ROI accuracy and precision, has been proposed as a practical metric for representing quantitation performance [10]. It is defined for each hot sphere k as
where f0 is the true activity in hot spheres, mr,k is the ROI average for each hot sphere k and realization r, and R is the number of realizations.(1)
III. Results
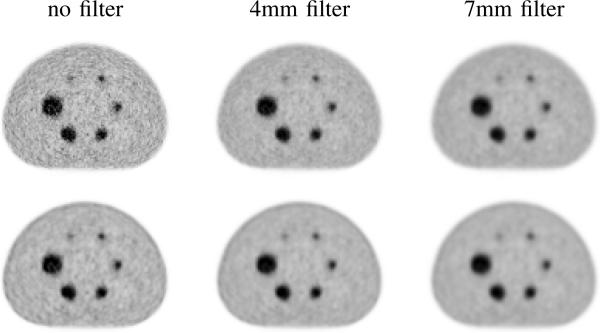
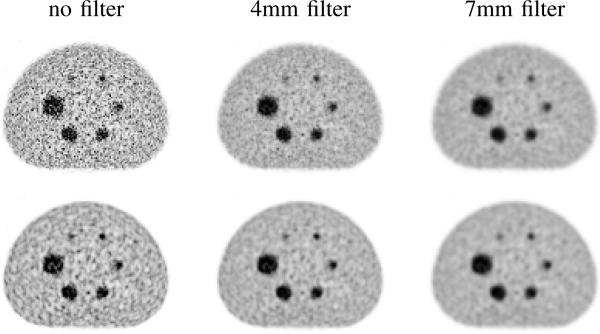
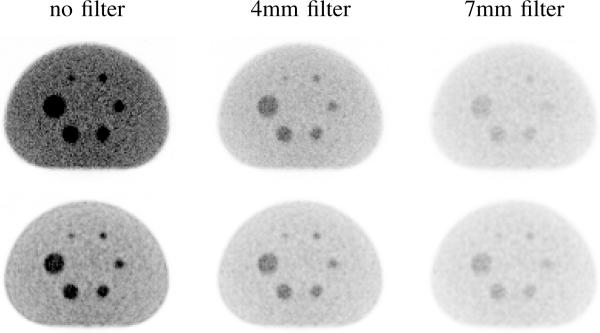
Figure 2 and 3 show example reconstructed images from one of the 50 realizations at iteration 2 and 8. From visual inspection, we observe differences in noise texture for different reconstruction methods. Specifically, PSF-based reconstruction results appear to be less noisy and to have a noise texture with larger correlations. We also observe variations of noise characteristics over different post filters and iterations. Objective evaluation of these noise properties is presented in the following.
Fig. 2.
Zoomed reconstructed images at iteration 2. Top: LOR; bottom: LOR+PSF. All images have the same color scale.
Fig. 3.
Zoomed reconstructed images at iteration 8. Top: LOR; bottom: LOR+PSF. All images have the same color scale.
A. Background Analysis Results
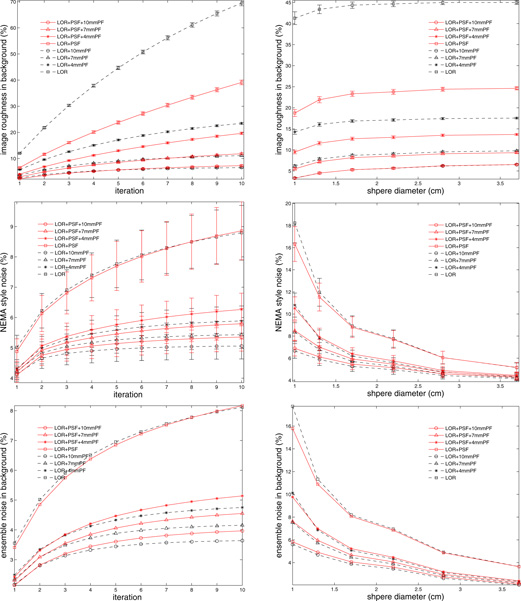
Figure 4 presents the results for the first 3 background noise metrics which are defined in Section II-C, namely image roughness, NEMA style noise, and ensemble noise. Each row of the figure corresponds to one noise metric. Since image roughness and NEMA style noise are defined on one realization, the mean of the metrics over 50 realizations is plotted in Figure 4 (top and middle rows), with the error bars denoting standard deviation across realizations. Each of the 6 plots in Figure 4 includes variations of 2 reconstruction algorithms (represented by black and red curves) and 4 post filtering options (represented by different line styles).
Fig. 4.
Metrics for background noise. From top to bottom: image roughness, NEMA style noise, ensemble noise. Left column: the ROI size is fixed at ROI of 22 mm diameter, and the metric is plotted versus the iteration number. Right column: iteration number is fixed, and the metric is plotted versus the ROI size. Error bars denote standard deviation across realizations.
From Figure 4, it is observed that all the three background noise metrics decrease with post filters applied, and increase with iteration number. Image roughness has a small increase for larger ROIs, while NEMA and ensemble noises go down quickly with increasing ROI size. Comparing the two reconstruction methods, the incorporation of PSF, with other parameters fixed, reduces image roughness by ~ 35% for the unfiltered data. With increasing post filtering, this noise reduction between the two methods gets smaller. The addition of the PSF offers no significant improvement in NEMA or ensemble noise at a fixed iteration.
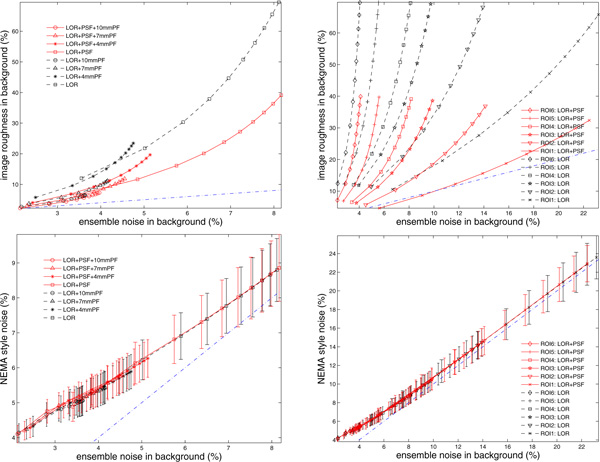
All the three noise metrics are defined as coefficient of variation, and their relations are studied by plotting one metric against another. In Figure 5, image roughness (IR) and NEMA style noise (NN) are plotted against ensemble noise (EN). The top row of Figure 5 plots the average image roughness over realizations versus the ensemble noise. It shows that while the mean of image roughness (over 50 realizations) increases monotonically with ensemble noise, there is not a linear relationship between the two metrics. The bottom row is related to the NEMA style noise. From these plots, a linear correlation is observed for the mean of NEMA noise (across 50 realizations) and the ensemble noise. This linear relation follows a line near the identity line, and has similar trend for different reconstruction methods, post filters, and ROI sizes. The error bars in the plots denote standard deviation across realizations, showing that NEMA style noise from one realization (represented by a line within the error bars) would also linearly correlate with the ensemble noise.
Fig. 5.
Relations of noise metrics in background. From top to bottom: mean of image roughness (over realizations), and mean of NEMA style noise (over realization), plotted against the ensemble noise. Left column: the ROI size is fixed (22mm diameter) and variations include different reconstruction methods and post filtering options. Right column: no post filtering is applied, and variations include different reconstruction methods and ROI sizes. Error bars denote standard deviation across realizations, and the dash-dot line denotes the identity line.
Results of the standard deviation image are presented in Figure 6. Comparing the plots on top and bottom rows (corresponding to OSEM+LOR and OSEM+LOR+PSF), we observe reduced sample standard deviation for PSF based reconstruction. As discussed earlier, each pixel in the standard deviation image is an estimate of the ensemble noise standard deviation, so reduced values in these images indicate that PSF based reconstructions have less noise. This noise reduction is observed in both the background and hot spheres, and the reduction gets smaller with increasing post filtering.
Fig. 6.
The standard deviation image at iteration 5. Top: LOR; bottom: LOR+PSF. All images have the same color scale.
B. Feature Analysis Results
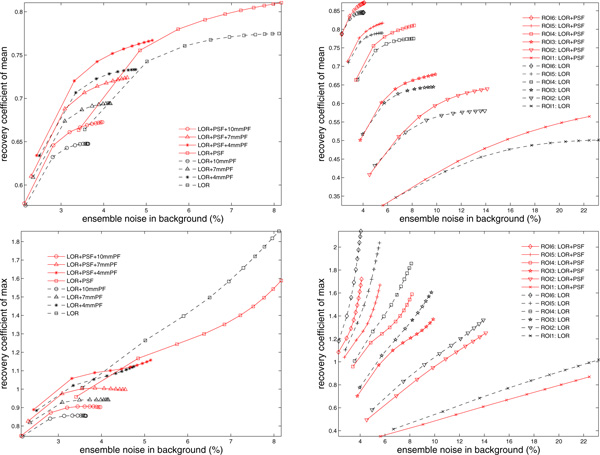
Figure 7 presents the results for contrast recovery coefficients. We plot CRCmean and CRCmax against the ensemble noise, so that we can compare the metrics for different reconstruction methods at a matched background noise level. For CRCmean, the PSF algorithm offers slightly improved (~ 7%) signal to noise performance over OSEM+LOR, and this benefit is present for all post filtering parameters and ROI sizes. A similar improvement is also observed for CRCmax. At the same contrast recovery, we observe reduced ensemble noise with PSF modeling included.
Fig. 7.
Relations of recovery coefficient in hot spheres and background noise. From top to bottom: mean of CRCmean (over realizations), and mean of CRCmax (over realizations), plotted against ensemble noise in background. Left column: the ROI size is fixed (22mm diameter) and variations include different reconstruction methods and post filtering options. Right column: no post filtering is applied, and variations include different reconstruction methods and ROI sizes.
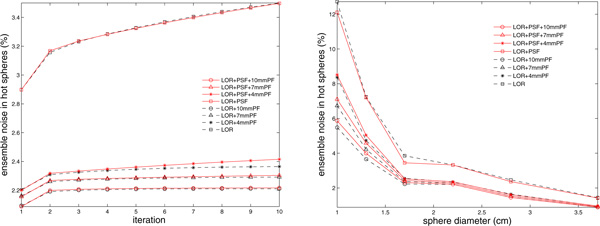
Ensemble noise in hot spheres is shown in Figure 8, and the patterns are similar to what we observe for background ensemble noise in Figure 4. The noise goes up with iteration, and decreases with post filtering and ROI size. Including PSF in the reconstruction does not reduce ensemble noise at a fixed iteration.
Fig. 8.
Ensemble noise in hot spheres.
Results for SNR measure are presented in Figure 9. SNRquant increases with hot sphere size, indicating better quantitation and detection performance for larger objects. SNRquant goes down with increasing post smoothing applied, and the amount of decrease is similar for each incremental increase in post filtering. As for the effects of PSF modeling, the addition of PSF increases SNRquant by 20% for unfiltered data, and this improvement exists for all post filtering and ROI sizes.
Fig. 9.
SNR measure of hot spheres. Left column: the ROI size is fixed at ROI of 22 mm diameter, and the metric is plotted versus the iteration number. Right column: iteration number is fixed, and the metric is plotted versus the ROI size.
IV. Discussion
Four different metrics have been used to quantify the noise properties in background. Among the metrics, image roughness and the standard deviation image are based on sample standard deviation of pixel values, so they are measures of pixel-to-pixel variation. Image roughness quantifies the variation from spatially correlated samples, while standard deviation image measures the variation across independent realizations.
The other two noise metrics, NEMA style noise and ensemble noise, are based on the sample standard deviation of the ROI mean values, and thus are measures of region-to-region variation. NEMA style noise quantifies the variation in the spatial domain, while ensemble noise captures the variation over different realizations. In Figure 5 (bottom row), we observe a linear correlation between NEMA and ensemble noise, and NEMA noise appears to be slightly larger than ensemble noise. Due to approximations in scatter correction and attenuation correction, the reconstructed image is not uniform in background. We observed from the mean image of 50 realizations that background activity is slightly lower in the center of the phantom, and such nonuniformity is similar for each realization. So spatial variation (measured by NEMA noise) is larger than ensemble variation (measured by ensemble noise). Despite this difference between NEMA and ensemble noise, the linear correlation of the two metrics exists for different combinations of reconstruction methods and parameters (Figure 5). Due to the lack of multiple realizations of acquisitions, noise metrics defined on a single realization of data (e.g. NEMA style noise) are often used to assess performance of algorithms or system designs. The linear correlation between NEMA and ensemble noise indicates that NEMA style noise is a reasonable surrogate for ensemble noise for the purpose of performance assessment when multiple realizations of data are not available.
Analysis in hot spheres shows improved contrast to noise performance with PSF modeling. Across a range of matched noise levels, OSEM+LOR+PSF offers roughly 7-12% improvement over OSEM+LOR in terms of contrast recovery coefficients (shown in Figure 7), demonstrating the advantage of adopting more accurate system models in reconstruction. This improvement in signal recovery, combined with the reduction in noise strength, leads to improved SNR measure (shown in Figure 9).
V. Conclusion
We have presented a systematic evaluation of noise and signal properties in different combinations of reconstruction methods and parameters for 3D PET image reconstruction. Our study is based on 50 sets of 3D PET data acquired on a clinical system. The data were reconstructed with two fully 3D reconstruction algorithms, OSEM+LOR and OSEM+LOR+PSF, in combination with 4 post filtering options and 1-10 iterations, yielding 4000 image volumes for our analysis. With access to multiple realizations of data, we use 4 metrics to quantify the background noise properties, and 4 metrics to evaluate the signal and noise characteristics in features. Among the four noise metrics, image roughness and standard deviations image are measures of the pixel-to-pixel variation, while NEMA and ensemble noises quantify the region-to-region variation. At the same number of iterations, the incorporation of PSF has demonstrated noise reduction effects on image roughness and the standard deviation image, but it offers no improvement for NEMA or ensemble noise. PSF based reconstructions have also shown improved signal to noise performance in terms of contrast recovery and SNR measures. We also study the relations of various noise metrics, and a linear correlation is observed between NEMA and ensemble noise for all combinations of reconstruction methods and parameters. This correlation indicates that NEMA style noise is a reasonable surrogate for ensemble noise when multiple realizations of data are not available.
Acknowledgment
The authors would like to thank C. Stearns and S. Ross for constructive discussions on image reconstruction.
This work was supported by a grant from GE Healthcare and NIH grant CA74135.
References
- 1.Qi J, Leahy RM, Cherry SR, Chatziioannou A, Farquhar TH. High resolution 3D bayesian image reconstruction using the microPET small animal scanner. Physics in Medicine and Biology. 1998;43(4):1001–1013. doi: 10.1088/0031-9155/43/4/027. [DOI] [PubMed] [Google Scholar]
- 2.Kadrmas DJ. LOR-OSEM: statistical PET reconstruction from raw line-of-response histograms. Physics in Medicine and Biology. 2004;49:4731–4744. doi: 10.1088/0031-9155/49/20/005. [DOI] [PMC free article] [PubMed] [Google Scholar]
- 3.Kadrmas DJ. Rotate-and-slant projector for fast LOR-based fully 3-D iterative PET reconstruction. IEEE Transactions on Medical Imaging. 2008;27(8):1071–1083. doi: 10.1109/TMI.2008.918328. [DOI] [PMC free article] [PubMed] [Google Scholar]
- 4.Strul D, Slates RB, Dahlbom M, Cherry SR, Marsden PK. An improved analytical detector response function model for multilayer small-diameter PET scanners. Physics in Medicine and Biology. 2003;48(8):979–994. doi: 10.1088/0031-9155/48/8/302. [DOI] [PubMed] [Google Scholar]
- 5.Alessio AM, Kinahan PE, Lewellen TK. Modeling and incorporation of system response functions in 3-D whole body PET. IEEE Transactions on Medical Imaging. 2006;25(7):828–837. doi: 10.1109/tmi.2006.873222. [DOI] [PubMed] [Google Scholar]
- 6.Panin V, Kehren F, Michel C, Casey M. Fully 3-D PET reconstruction with system matrix derived from point source measurements. IEEE Transactions on Medical Imaging. 2006;25(7):907–921. doi: 10.1109/tmi.2006.876171. [DOI] [PubMed] [Google Scholar]
- 7.Manjeshwar RM, Ross SG, Deller TW, Sterns CW. Fully 3D PET iterative reconstruction using distance-driven projectors and native scanner geometry. IEEE Nuclear Science Symposium; 2006.pp. 2804–2807. [Google Scholar]
- 8.Alessio AM, Kinahan PE, Harrison RL, Lewellen TK. Measured spatially variant system response for PET image reconstruction. IEEE Nucl. Sci. Symp. and Med. Imaging Conf.; Puerto Rico. 2005.pp. 1986–1990. [Google Scholar]
- 9.Daube-Witherspoon M, Karp J, Casey M, DiFilippo F, Hines H, Muehllehner G, Simcic V, Sterns C, Adam L, Kohlmyer S, Sossi V. PET performance measurements using the NEMA NU 2-2001 standard. Journal of Nuclear Medicine. 2002;43(10):1398–1409. [PubMed] [Google Scholar]
- 10.Barrett HH. Objective assessment of image quality: Effects of quantum noise an object variability. Journal of Optical Society of America. 1990;7(7):1266–1278. doi: 10.1364/josaa.7.001266. [DOI] [PubMed] [Google Scholar]


