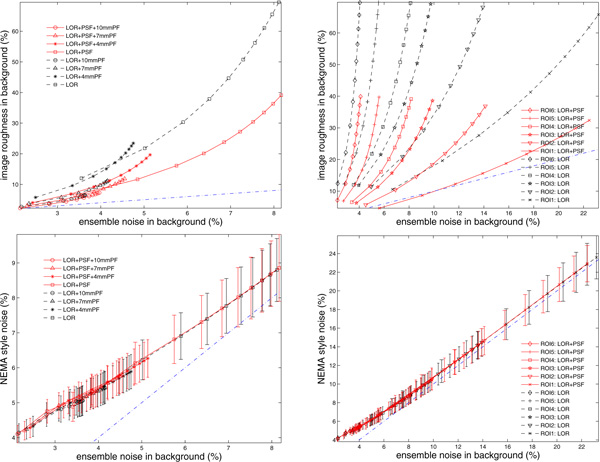
Fig. 5.
Relations of noise metrics in background. From top to bottom: mean of image roughness (over realizations), and mean of NEMA style noise (over realization), plotted against the ensemble noise. Left column: the ROI size is fixed (22mm diameter) and variations include different reconstruction methods and post filtering options. Right column: no post filtering is applied, and variations include different reconstruction methods and ROI sizes. Error bars denote standard deviation across realizations, and the dash-dot line denotes the identity line.

