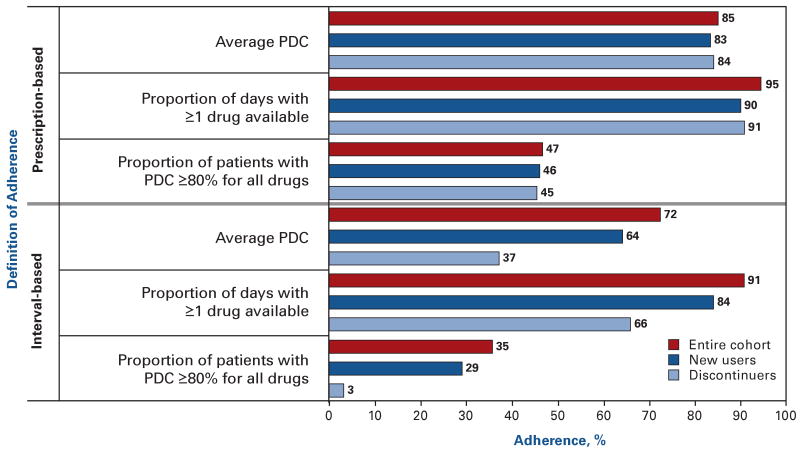
Figure 3. Adherence Rates for Oral Hypoglycemic Agents Among Patients Prescribed More Than 1 Class of Agents.
PDC indicates proportion of days covered.
The burgundy bars represent adherence estimates for the entire cohort (N = 7567). The dark blue and light blue bars represent subgroups of patients who newly initiated therapy and who discontinued therapy altogether, respectively.

