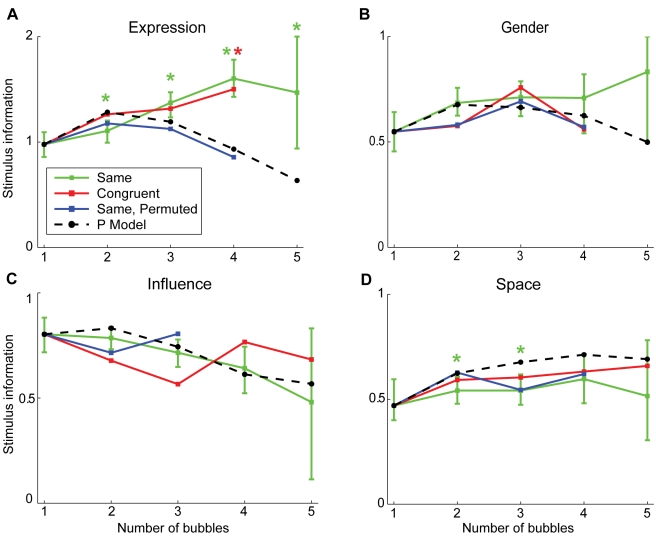
Figure 2. Stimulus information versus number of bubbles for the four tasks.
Stimulus information estimated using the p-model is plotted for all four tasks (black dashed line). This is contrasted with the measured stimulus information in the same condition (green line) and in the congruent condition (red line). The blue line marks the measurements that result if the positions of bubble stimuli of the same condition are shuffled (same, permuted). The colored stars mark significant differences (p<0.05, bootstrapped confidence intervals) between the curve belonging to the respective condition and the p-model estimate. For visibility, the 95% confidence interval is marked by error bars only for condition same.

