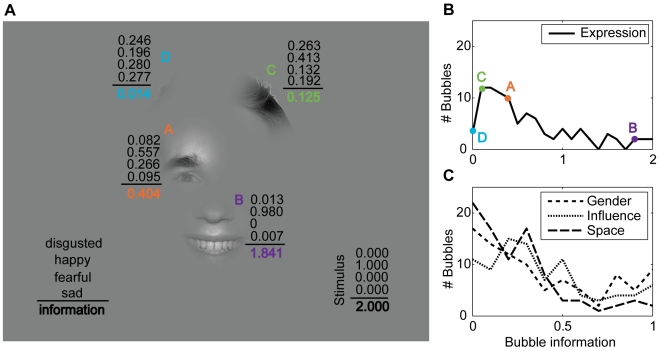
Figure 4. Bubble information.
(A) Example stimulus from the expression task where the individual bubbles are labeled by their fitted response distributions and the corresponding bubble information. The four numbers above the black line give the response probabilities for the classes “disgusted,” “happy,” “fearful,” and “sad.” The bold number below the line gives the bubble information (in bit). For the whole stimulus, the measured response distribution and stimulus information (in bit) is given in the lower right corner. (B) The distribution of bubble information for the expression task. The bubble information of the four bubbles of the example stimulus is marked by colored dots. (C) The distribution of bubble information for the other three tasks gender, influence and space.

