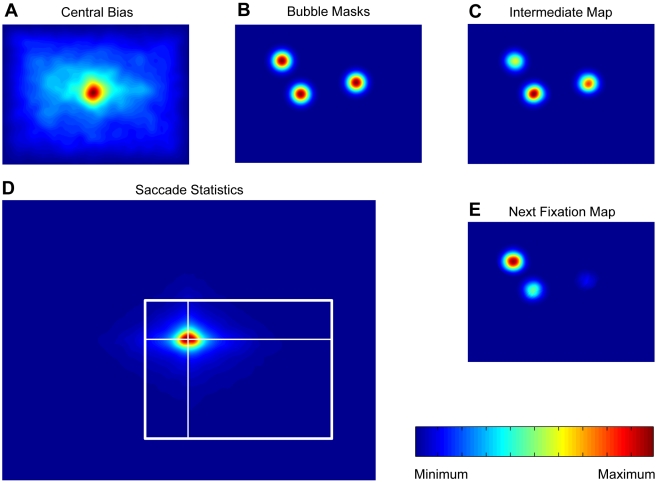
Figure 13. Simulation of fixation trajectories based on spatial biases.
Spatial bias salience was computed from simulated fixation trajectories based on the central bias of fixations, saccade statistics, and bubble positions. Given the current fixation location, the next fixation is generated by, first, multiplying the central bias map (A) with the bubble position map (B). Second, the resulting intermediate map (C) is multiplied with the probability distribution over saccade vectors (D) centered at the current fixation. The next fixation is then sampled from the resulting map (E). For example, assuming a fixation of the upper left bubble in panel C, the multiplication (indicated by the white coordinate frame) of the intermediate map (C) and saccade statistics (D) results in the depicted next fixation map (E). Repeating this sampling procedure resulted in the simulated fixation trajectory.

