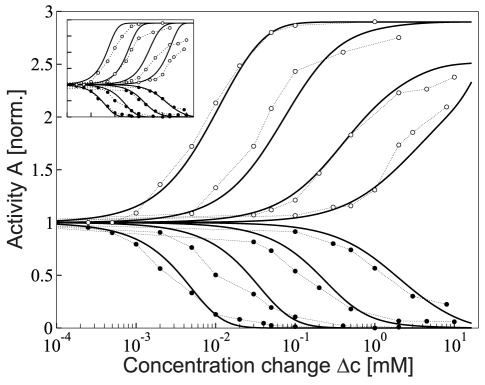
Figure 1. Response of wild-type cells to step changes  of MeAsp concentration at different ambient concentrations.
Dose-response curves: Symbols represent averaged response from FRET data (WT1) after adaptation to ambient concentrations 0, 0.1, 0.5 and 2 mM as measured by Sourjik and Berg [23] (filled and open circles correspond to response to addition and removal of attractant, respectively). Solid lines represent the dynamic MWC model of mixed Tar/Tsr-receptor complexes including ligand rise (addition) and fall (removal), as well as adaptation (receptor methylation) dynamics. (Inset) Dose-response curves for MWC model without adaptation dynamics (lines). FRET and receptor complex activities were normalized by adapted pre-stimulus values at each ambient concentration. Squared errors between model and experimental data for the four dose-response curves shown are 0.64 (dynamic MWC model) and 3.95 (static MWC model), respectively. For comparison, fitting to eight addition and removal dose-response curves using  ,
,  , as well as a linear function
  as fitting parameters, yields squared errors 0.83 (dynamic MWC model) and 2.09 (static MWC model), see Supplementary Text S1.

