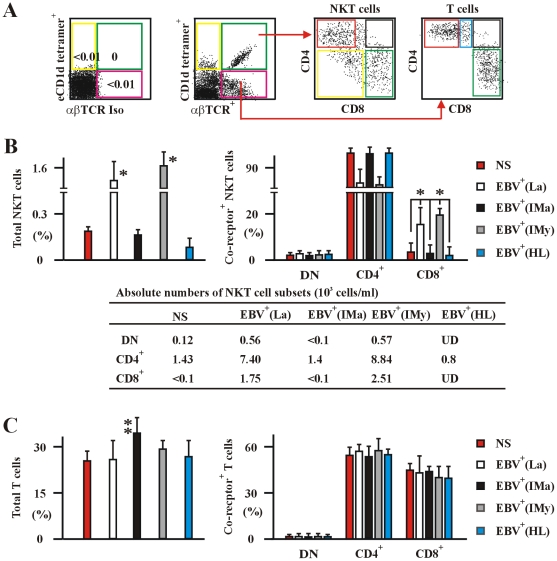
Figure 1. Human NKT and T cells in the various EBV-infected and non-infected subjects.
(A) The experimental and analysis scheme for detecting co-receptor-expressing NKT cells and T cells in PBMC was illustrated. The data to establish negative staining gates with fluorochrome conjugated empty CD1d tetramers (eCD1d tetramer) and αβTCR isotype mAb (αβTCRIso) control was shown in rightmost panel of this subfigure. (B) and (C) Frequencies of total (left panel) and co-receptor-expressing (right panel) NKT (B) and conventional αβT cells (C) in PBMCs from healthy latent EBV-infected subjects [EBV+(La)], newly-onset acute infectious mononucleosis patients [EBV+(IMa)], IM patients at year 1 post-onset [EBV+(IMy)], EBV-associated HL patients [EBV+(HL)] and EBV-negative normal control subjects (NS) assessed by flow cytometry. The absolute numbers per ml of NKT cell subsets of various patient and subject were shown in bottom panel as means ± s.d. (the s.d. was not shown for simplicity of the figure) (B). Data were mean ± s.d. (For patient numbers see Table S1). *, p<0.001.

