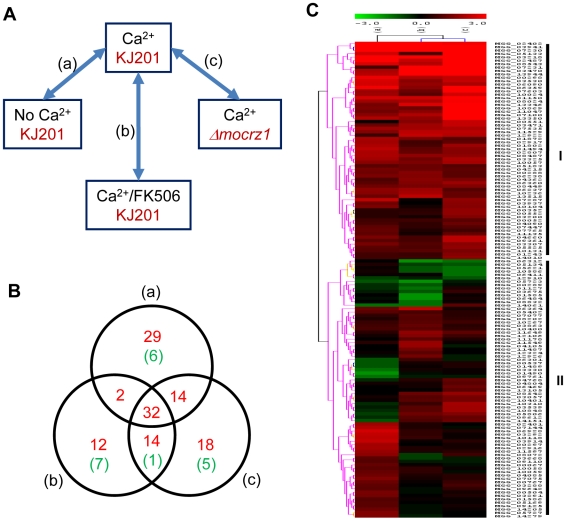
Figure 3. Expression dynamics of MoCRZ1 targets.
(A) Expression microarray design. Wild type strain KJ201 and MoCRZ1 deletion mutant (Δmocrz1) were treated with Ca2+ and/or FK506 as depicted. Agilent M. oryzae whole genome microarray chip ver. 2 was hybridized in a single channel design with four biological replications per treatment. After global normalization of signal intensities to the average expression level of all probes among the 16 data sets, pairwise comparison between treatments was conducted. (B) Venn diagram showing number of genes identified from ChIP-chip and up-regulated in transcriptome profiling described in panel A. Number of genes with more than 2 fold differential expression with P<0.05 were noted as red for up-regulation and green for down-regulation in Ca2+ treated wild type samples in each comparison. (C) Hierachical clustering resulted in two large groups with differential expression.

